Search This Blog

Tuesday, October 26, 2010

Processes and Tools for Planning a Program - 6

Systems Engineering Management Plan (SEMP) - NASA’s Systems Engineering Handbook has concise definitions for the IMP and SEMP that are summarized here. The IMP, described above, defines how the project will be managed to achieve its goals and objectives within defined programmatic constraints. The Systems Engineering Management Plan (SEMP) is the subordinate document that defines to all project participants how the project will be technically managed within the constraints established by the IMP. The SEMP communicates to all participants how they must respond to pre-established management practices.
Note that the SEMP relates the planned systems engineering work to pre-established practices. This means, that like the IMP, the SEMP does not have to define from scratch how the project will be technically managed; it just has to define what standard practices will be used and any deviations from standard practices. Therefore, again like the IMP, the SEMP should not be a monster sized document that no one will ever read. There is a good discussion of SEMPs in NASA’s Systems Engineering Handbook. A concern with the NASA discussion is that it may lead teams to develop SEMPs that are much too detailed and therefore much too time consuming and expensive to prepare. The same concern exists with the discussion of the SEMP in IEEE Std. 1220. An outline for a SEMP that addresses these concerns was developed by Eric Honour of Honourcode, Inc. of Pensacola, FL in 2003.
A copy of Eric Honour’s outline is presented here with his permission. The only significant change made to is to strongly recommend that we recognize that today project documentation is almost always maintained in electronic format accessible via an enterprise’s intranet. Therefore one key to high quality documentation is achieving the “best” balance between copying material from one document to another and hyper linking between documents. An excess of hyper linking makes reading more tedious but excessive duplication also makes reading tedious for those that have already read other documents. A prescription for the “best” balance is not recommended here since it depends on the documentation particular to a specific organization. Authors of project planning documents should use their best judgment for achieving a good balance.
The following is Eric Honour’s outline in italics with the author’s comments in normal type:

 The topics and outline provide comprehensive coverage. Each topic should be considered in the planning for a program, and then reviewed at the beginning of each subsequent phase. Some topics may only receive cursory consideration in early phases, with later expansion. (E.g. Producibility Analysis, System Implementation Transition)
The SEMP should contain only those processes and plans that are unique to the program.
Initial creation of a SEMP should require between 2-5 working days. Expansion of the SEMP to full planning later may take 2-4 weeks. Revision effort during later phases varies from 2 days to 3 weeks.
A complete SEMP may be as few as 5 pages, or as many as 50.
 Annotated Outline
1.0 INTRODUCTION (Note that this section and section 1.1 should be identical to that in the IMP and copied from the IMP.
1.1 Overview
Identify the system and this document in one sentence. Use a sentence or two to summarize the purpose of this plan.
1.2 System Description
Describe the system, using text and/or figures as appropriate. This identical system description can be used in all plans created for this program. (E. g. define the design architecture using hardware and software trees.)
2.0 REFERENCED DOCUMENTS (Here is an example where the IMP should link to this List.)
List all documents that are specifically referenced within this document. Provide document number (including revision letter) and name in the format: ANSI/EIA-632 Processes for Engineering a System
3.0 TECHNICAL PROGRAM PLANNING AND CONTROL
3.1 Task Descriptions
3.1.1 Definition of Work
Define the technical work that must be performed under the contract. Show the contract work breakdown structure (CWBS), and describe the scope of each technical work package. Indicate the flow down of CDRL items to work packages (can be shown on the CWBS).
3.1.2 Subcontractor Work Effort
Define the work efforts to be performed by subcontractors or teammates under the contract. Identify the CWBS work packages containing this effort.
3.1.3 Schedule
      Show the program schedule. Identify development phases and major milestones. Show a task       network of task dependencies, with critical path. (I would copy the one page Master schedule   from the IMP and link to the detail schedule or IMS)
3.2 Organization
3.2.1 Technical Organization
Show a diagram of the technical project organization. Also include diagrams of the related program organization and functional organizations. In creating this diagram, consider the principles of concurrent engineering.  (Here is another opportunity for the IMP to link to more detailed information in the SEMP.)
3.2.2 Technical Functions
Provide a textual description of the responsibilities of each person in the technical project organization. Cross-reference responsibilities to the CWBS. Include subcontractor personnel, and include subcontractor monitoring responsibilities. (Section 4.3 of NASA’s System Engineering Handbook has an excellent and concise discussion of tying the lowest level of the CWBS to the responsible engineer or manager.)
3.2.3 Program Interfaces
Define the formal and informal technical interfaces to others. Consider customer and internal technical interface meetings, interface control working groups, and standards committees. Define how to control the interfaces - authority and responsibility.
3.3 Technical Control (Don’t forget the instruction in the beginning to include only things that are unique to the project. Don’t describe standard processes. Just note any tailoring specific to the project.)
3.3.1 Requirements Management
Describe the plans to manage technical issues on the program. Identify technical project meetings, issues tracking lists, issue resolution methods, and resolution authority.
3.3.2 Technical Issues Management
Describe the plans to manage technical issues on the program. Identify technical project meetings, issues tracking lists, issue resolution methods, and resolution authority.
3.3.3 Risk Management
Describe the plans to manage and mitigate technical risks on the program. Identify risk levels, threshold criteria and decision authority. Identify methods to identify risk, analyze risk and track risks. (Make the detailed Risk Management Plan a separate document and provide an overview here with links to the detailed plan. The reason is that the Risk Management Plan is a very active document that needs to be updated much more often than a SEMP as risks are mitigated and new risks are identified.)
3.3.4 Interface Control
Describe the plans to control interfaces within the system and between the system and other systems. Identify the interfaces to be controlled.
3.3.5 Configuration Control
Describe the plans to control baseline configuration of the system design. If a separate Configuration Management Plan exists, refer to it.
 3.3.6 Document Control
Describe the plans to control the documents on the program. Consider master documents, copies, and distribution. Include documents created by the program team and those received from external sources. (The plans should include an “Information Architecture” diagram. Include the diagram in this section along with the descriptions recommended.)
3.4 Performance Control
3.4.1 TPM Process
Define the process to gather and calculate Technical Performance Measures (TPM). Define the frequency of measurement. Define the methods to disseminate the results, including management visibility.
3.4.2 Technical Performance Measures
Define the TPMs to be calculated. Define the raw data required and sources. Define the calculation methods for each TPM.
3.5 Program and Design Reviews
3.5.1 Review Process
Define the process to be followed for program and design reviews.
3.5.2 Review Schedule
Show a schedule for the specific program and design reviews to be used. Describe the purpose and content of each review. (The reviews should be on the Master schedule. Only describe them here if the project is deviating from the organization’s standard processes for reviews. If the reviews are tailored project leaders should distribute copies of the tailored checklists ahead of preparation for each review; otherwise workers are likely to refer to standard documentation for reviews rather than to dig instructions out of the SEMP.)
4.0 SYSTEM ENGINEERING PROCESS
4.1 Process Description
In the subsections that follow, describe the program-unique processes in each phase. Use standards as a reference, and do not restate the processes therein. Consider each activity in each phase. Specifically address the automated tools that will be used and their interconnection.
4.1.1 Operational Definition
4.1.2 Requirements Definition
4.1.3 System Architecting
4.1.4 Preliminary Component Design
4.1.5 Detailed Component Design
4.1.6 Prototype Manufacture
4.1.7 System Integration
4.1.8 System Verification
4.1.9 System Validation
4.1.10 Operation and Maintenance
4.2 Related Processes
4.2.1 Electronics
Define the specific electronic engineering development processes to be used. Define the types of system engineering support required.
4.2.2 Software
Define the specific software development processes to be used. Define the types of system engineering support required.
4.2.3 Mechanical
Define the specific mechanical engineering development processes to be used. Define the types of system engineering support required.
4.2.4 Process Development
Describe the methods by which program processes will be monitored and improved. Consider the impact on systems engineering and other processes.
4.3 Trade Studies
4.3.1 Trade Study Process
Describe the process to be used in performing trade studies. Consider trade matrix formats, depth of analysis, and types of information. Describe how to handle multi-dimensional interdependencies.
4.3.2 Trade Study Tasks
Identify the major system trade studies to be performed. Indicate the issues and constraints, including interdependencies. (I highly recommend an N-Squared diagram be included here or linked to. See previous posts on N-Squared diagrams.)
4.4 Requirements Allocation
Describe the unique processes to be used to allocate requirements to system components. Use standards as a reference, and do not restate the processes therein.
4.5 Design Optimization/Effectiveness
4.5.1 Analysis Methods and Tools
Describe the mathematical, simulation, and/or prototyping methods to be used to optimize the design and measure its effectiveness. Define how these methods will be used to impact the design, in which phases. Identify the specific tools to be used. Describe how to handle multi-dimensional interdependencies.
4.5.2 Design Analyses
Identify the specific analyses, simulations, and/or prototypes that will be developed. Identify when each analysis will be performed, and by which personnel. Identify the issues and constraints on each, including interdependencies. Identify the results anticipated from each. Include technical and cost analyses. Consider the following possible types of analysis:
􀁹 Performance Analysis (Throughput, Latency, Dynamic Range, Bandwidth, Memory, etc.)
􀁹 Logistic Support Analysis
􀁹 Life Cycle Cost
􀁹 Design to Cost
􀁹 Design for Manufacturability
􀁹 Design for Test
􀁹 Producibility
4.6 Documentation (Additional recommendations for defining documentation are given below in the section titled Information Architecture.)
4.6.1 Specification Tree
Show a hierarchical diagram of the specifications that will be created for the system and its elements. Identify the type of each specification. Indicate which specifications are internal and which must be delivered. (Replace the specification tree with a document tree for a more complete description.)
4.6.2 Other Documents
List other documents that will be created. Indicate which documents are internal and which must be delivered.
4.6.3 Document Generation Methods
Describe the methods to be used to generate documents. Identify the specific tools, and their required interconnections. Describe the review and sign-off process.
5.0 ENGINEERING SPECIALTY INTEGRATION
5.1 Control of Engineering Specialties
Describe the integration and coordination of the various engineering specialties in each system engineering phase. Indicate how system engineering controls achieve the best mix of technical/performance values. Where the specialty programs overlap, define the responsibilities and authorities of each.
5.2 Integrated Logistics Support Plan
Summarize the approach to Integrated Logistic Support (ILS). Refer to a separate ILS Plan, if available. Consider the aspects of Logistic Support Analysis, Provisioning, and Training. Indicate the information needed by ILS and its source and time of need. Indicate the expected results and when.
5.3 Reliability/Maintainability/Availability Plan
Summarize the approach to Reliability/Maintainability/ Availability (RMA) analysis and control. Refer to a separate RMA Plan or plans, if available. Indicate the information needed by RMA and its source and time of need. Indicate the expected results and when.
5.4 Safety Plan
Summarize the approach to safety analysis and control. Refer to a separate Safety Plan, if available. Indicate the information needed by safety engineers and its source and time of need. Indicate the expected results and when.
5.5 Human Factors Engineering Plan
Summarize the approach to human factors analysis and control. Refer to a separate HFE Plan, if available. Indicate the information needed by human factors engineers and its source and time of need. Indicate the expected results and when.
5.6 Security Plan
Summarize the approach to security analysis and control. Refer to a separate Security Plan, if available. Indicate the information needed by security engineers and its source and time of need. Indicate the expected results and when.
5.7 Electromagnetic Effects Plan
Summarize the approach to electromagnetic effects analysis and control. Consider EMI, EMC, and TEMPEST as appropriate. Refer to a separate plan, if available. Indicate the information needed by electromagnetic effects engineers and its source and time of need. Indicate the expected results and when.
5.8 Value Engineering Plan
Summarize the approach to value engineering analysis and control. Refer to a separate plan, if available. Indicate the information needed by value engineers and its source and time of need. Indicate the expected results and when.
5. X (Other Plans)
(Describe other applicable specialty plans and programs such as: Test & Evaluation Master Plan; Quality Assurance; Nuclear Survivability; and Parts Control)

Tuesday, October 19, 2010

Processes and Tools for Planning a Program - 5

Critical Path Analysis – Critical path analysis needs further discussion because of issues that have emerged in modern complex projects. Modern software scheduling tools automatically determine and show the critical path for a project schedule. However, it is not good practice to just accept the first result for a complex project.
The simple example schedule discussed in the previous sections is a deterministic schedule; each task has a planned duration, a predecessor task and a successor task. Therefore there is a deterministic critical path. It should be obvious that the time estimate for each task has a probability associated with it. That is, there is some probability that the task will be completed in the time estimated. Therefore there is also a probability that an overall project will be completed in the time estimated by summing the times for the tasks on the critical path. Unfortunately project schedules are sometimes treated by project leaders, managers and customers as though the schedule is deterministic and any overrun in schedule is the result of poor management rather than the result of real world variation due to probabilistic time estimates.  Likewise the team management is given credit for excellent management should the project come in ahead of schedule due to the same variation phenomena.  Of course there is usually some truth in assigning credit or blame to the project leaders because they have numerous tools for managing a project in order to maintain schedule in spite of variations in the time to complete individual tasks. However, using probabilistic time estimates in PERT scheduling, or the alternative recommended in Glen B. Alleman’s blog cited in the section on developing schedules, gives both the project leaders and those overseeing the projects a much better feel for the likelihood that the project will complete by a certain date.
Probabilistic time estimates are achieved by estimating an optimistic time, a pessimistic time and a most likely time for completing each task.  The expected task duration is then defined as the mean of the distribution defined by the three estimates and is between the most likely and the pessimistic times for a beta distribution used in the standard probabilistic approach.  One might expect that the critical path is the sum of tasks with zero slack in the resulting network using expected durations. But since there is a variance for each task estimate there is also a variance for the critical path schedule and therefore a probability associated with completing the project by any number of days less or more than the expected total. Since all tasks have a time to completion variance there is also probability that some path other than the most probable critical path becomes the critical path. Thus to get the most accurate probabilistic estimate of overall schedule it is necessary to analyze all paths and the probability that the project will complete by a certain date is actually the probability that all paths will complete by that date. Alternately simulations considering all paths can be carried out. A shortcut to analyzing all paths may be useful for some projects.
Consider the example of projects for developing systems with hardware and embedded software. There are often several candidates for the critical path in the early part of such projects. This is in contrast to complex projects in the past without embedded software. In the past there was typically some long lead part or assembly that drove the overall schedule so that the critical path usually turned out to be driven by the design and procurement of this long lead item. Modern digital electronics enable systems with complex data acquisition and analysis. Such systems often have special purpose digital circuits with embedded software involved in the acquisition and processing of data. The digital circuit design is usually a relatively high risk task so the designers want to build and test breadboard circuits as soon as possible so that designs can be refined and risk reduced before integrating these circuits with the overall electronics. However, these circuits require embedded software for carrying out their intended functions. Systems engineering must develop specifications for both the digital hardware and for the software. If the scheduling is done in the usual way these tasks end up driving the overall schedule in unsatisfactory ways. Managers may become confused if they expect the usual long lead parts to be driving the critical path, not risk reduction tasks.
To get estimates for scheduling the digital electronics and software tasks so that the risk reduction tasks aren’t on the critical path it is necessary to get the digital designers, the software engineers and the systems engineers to sit down together and work out plans to make these tasks fit together and complete as early as possible. Even with the best efforts of the engineers the resulting schedules often end up with digital electronics, embedded software and some long lead parts all having paths with zero or near zero slack. This says that it’s not possible to accurately tell which will end up the true critical path because of the variance in the time for each path is larger than the difference in slack. A way to handle such scheduling problems is to calculate the expected duration of each of these potential critical paths. It’s not necessary to calculate the expected duration for all paths on such projects because it is highly likely that these few paths with near equal durations drive the critical path. Determining the expected duration for each of these few paths also helps convince managers that the scheduling is sound even if their assumed critical path turns out to be not the most likely critical path.
The situation described for complex systems having special purpose digital electronics and embedded software seems likely to occur in other types of complex projects. If an organization is using deterministic schedules and is faced with a project schedule that has several paths with zero or near zero slack it is recommended to use probabilistic time estimates and to calculate the expected duration for the several candidate critical paths. It likely isn’t necessary to expend the effort and cost to calculate the expected durations for all paths. If an organization uses probabilistic scheduling routinely then spend the effort to involve all the personnel on the tasks that are candidates for the critical path so that they reach an understanding of the relationships of each other’s tasks and explore approaches to workarounds that may shorten schedules as well as result in a better estimate of the true critical path.

Tuesday, October 12, 2010

Processes and Tools for Planning a Program - 4

Rolling Wave Scheduling - Projects have schedule risk due to uncertainty in the outcomes of future design and risk management actions. Therefore it is not possible to predict long term schedule details with high confidence. If long term schedules are prepared in detail then these details become inaccurate and require rescheduling after a few months of work. The detail schedule should be developed using rolling wave planning to minimize having to rework the detailed planning whenever an unexpected event changes the work and requires replanning of future work in order to meet the intended milestones. Rolling wave planning is a method of managing in the presence of future uncertainty due to risk. Plan the schedule in detail for two to four month periods, e.g. to the next major milestone, and with less detail beyond this period. The schedule should be updated regularly to maintain two to four months of future detailed schedule. This is necessary to identify contentions for critical resources and plan for resolving these contentions. (Recall the value of progressive design freeze discussed earlier.) Note that the NASA Handbook recommends rolling wave scheduling but suggests scheduling in detail for one year periods. A year is too long and results in unnecessary rework of schedules.
A second reason rolling wave planning is effective is that risk mitigation activities should be integrated into the master schedule. Risk management is an ongoing activity; as selected risks are mitigated others take their place. Design decisions can lead to the identification of new risks that must be mitigated. Rolling wave planning and scheduling allows the dynamic risk mitigation tasks to be integrated into the overall project schedule and budget; facilitating effective management.  Thus rolling wave planning allows efficient planning in the presence of uncertainty of design results due to the risks inherent in product development.
An Alternative Scheduling Approach - The section on defining and sequencing tasks described how to use N-Squared diagrams to define and sequence project tasks in the optimum sequence. N-Squared diagrams are an alternative to the work flow diagrams described in the NASA Systems Engineering Handbook.  Let’s assume that detailed N-Squared diagrams, or work flow diagrams, have been developed for the first phase of a project. This means that there is a top level diagram for the entire project that defines the top level summary tasks and their interrelationships. There are more detailed diagrams for the second and third levels of those top level tasks associated with the first phase of project work, e.g. from project initiation to the first major milestone. Now the job is to convert this task data into a time phased detailed schedule for the first phase of project work.
Assuming that a modern scheduling tool, such as MicroSoft Project, is used it doesn’t really matter whether the final schedule is a Gantt chart or a PERT chart because the scheduling tool can automatically generate one from the other. Thus there are several paths that can be followed from the N-Squared diagrams to the final detailed schedule for the first phase of project work. The N-Squared diagrams contain all the information necessary to go directly to either a PERT or Gantt chart. However, if the person generating the schedule isn’t highly experienced there is an alternate path that is often helpful where there are many feedback loops and possibilities for starting tasks in parallel. This path inserts a second diagram between the N-Squared diagram and the PERT or Gantt schedule.
This second diagram is called a Time Blocked Task List. It’s a simpler form of the work flow diagram or the precedence diagram defined in the NASA handbook in that it only displays sequencing of tasks. Working from the detailed level N-Squared diagrams generate rows of squares with task numbers in each square like the squares and task numbers in the N-Squared diagram. Except now tasks are not confined to the diagonal squares. The idea is to put tasks that feed from one to another in sequence on the same row or adjoining row. If the N-Squared diagrams indicate that two tasks can be started in parallel then put the second task in a row below the row containing the first task and directly below the first task. These are not rigid rules; any form is acceptable as long as each output from each task is separately feeding its appropriate destination task. What is important is positioning the tasks in columns so that the columns are in the sequence the tasks must be performed, hence the name time blocked task list. Arrows are drawn between tasks showing the feed of information from task to task.
If there is a feedback loop where data from a task is needed to replace assumptions or estimates used in earlier tasks and the earlier task must be repeated after the data is available indicate the second pass through tasks with squares following the first pass task and in the same row. Use the same task number but add a letter designator showing that this block is a second pass through the task. An example of a simple time blocked task list is shown in Figure 4-3 for the N-Squared diagram shown in Figure 4-1. This diagram explicitly shows the tasks that must be repeated due to feedback loops. The position of block 4 shows that this task can start at any time between the beginning of the project and just early enough to complete as soon as task 3a completes so that task 5 is not delayed.


Figure 4-3 A Time Blocked Task List explicitly shows sequencing of tasks in feedback loops.

The value of the Time Blocked Task List is that it enables the inexperienced person scheduling tasks to identify more clearly when parallel tasks can be scheduled and it forces recognition that feedback loops require additional time to complete the second pass through the tasks involved. The reason that it’s so important to clearly identify when parallel tasks can be scheduled is that this gives maximum schedule flexibility in scheduling critical resources. Experienced schedulers can skip the Time Blocked Task List but it’s worth the effort for inexperienced schedulers to ensure that parallel tasks are clearly defined as to possible start and finish times and that time is explicitly scheduled for executing feedback loops. There is no need to develop a time blocked task list for an entire project, just block out tasks that have feedback loops and possibilities for parallel starts. Having worked out these details in the simple Time Blocked Task List it is easy to develop accurate Gantt or PERT charts. An example Gantt chart schedule for these tasks is shown in Figure 4-4.

Figure 4-4 An example schedule chart for the six tasks defined and sequenced in Figure 4-1.

Tuesday, October 5, 2010

Processes and Tools for Planning a Program - 3

Defining Tasks and Developing Schedules
Defining and Sequencing Tasks – The NASA Systems Engineering Handbook discusses in section 4.4 the use of work flow diagrams (WFD) for developing schedules. The WFD is a graphical representation of tasks, task precedencies or dependencies and “products or milestones” that occur as a result of one or more tasks. Using the WFD as defined can lead to scheduling problems due to not fully defining each task. It’s possible to expand the definition of the WFD so that tasks are fully defined. However, there is a simple tool for more completely defining and sequencing tasks that can be used in conjunction with or independently of the WFD before any schedule below the top level is developed.
A simple and effective tool for defining and sequencing detailed tasks is the N-Squared diagram.  N-Squared diagrams are traditionally used in defining software and hardware interfaces but are just as valuable for defining interfaces between tasks. N-Squared diagrams are constructed for tasks and subtasks as a nested set using spreadsheet tools. Tasks are listed in squares along the diagonal set of squares in an N x N matrix of squares. In addition to putting the task name in a diagonal square other information useful to the project team can be added; e.g. the Work Breakdown Structure (WBS) number of the task, or perhaps the task leader’s name, or a paragraph number in a proposal or task description document that describes the task.
N-Squared diagrams can be developed top down or bottoms up or using a mix of bottoms up and top down. Here it is described as a top down process but don’t be constrained by this description. Start with a list of N tasks of the same level in the order you think they need to be executed. Top level tasks often have multiple levels of subtasks. List each top level task in turn in one of the squares along the diagonal of the N x N matrix.  The N-Squared diagrams for the subtasks of each task are constructed as separate diagrams.
The next step is to write the external inputs to the tasks in the row above the diagram and above the square containing the task that the external inputs feed into. Then write the outputs of the first task in squares that are to the right of the first square in the first row of squares. Each output is to be in the square directly above the diagonal square containing the task that requires the output from the first task as an input.  Then continue this process for each diagonal square. Outputs that feed tasks in diagonal squares that are above the row go in boxes to the left of the diagonal square and outputs that feed tasks in diagonal squares that are below the row go in boxes to the right of the diagonal square. This process defines the tasks in that the inputs and outputs of each task are identified along with the sources of the inputs and the tasks that need the outputs.
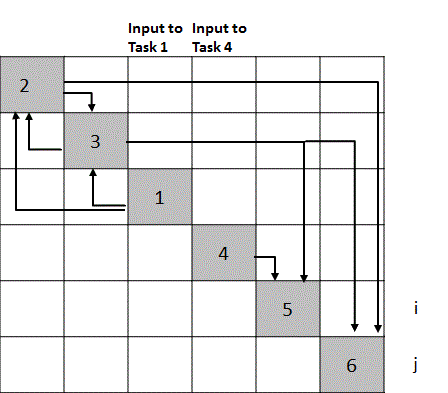
After completing this listing of outputs for each diagonal square examine the form of the resulting N x N matrix. A simple example with six tasks, one external input to task 1 and two outputs from tasks five and six is shown in Figure 4-1. In this figure the tasks are labeled with numbers along the diagonal and the outputs from tasks are labels with letters. Arrows can be added to make it clear which task each output feeds, as shown in Figure 4-1.


Figure 4-1 An N-Square diagram is a useful tool for defining tasks and the relationships between tasks.
An ideal sequence of tasks for a perfectly sequential project has outputs only to the right side of the diagonal. Typical projects have some tasks with outputs on the left of the diagonal squares. These outputs represent feedbacks to earlier tasks. Typically in executing the tasks in the diagonal squares that have feedbacks from tasks in squares in lower level squares assumptions or estimates are made for the inputs needed from lower level tasks and the tasks are reviewed or repeated after the lower level tasks are completed. Thus the form of the N x N diagram defines how efficiently the tasks are ordered. If there are a lot of outputs on the left side of the diagonal it is necessary to see if reordering the tasks results in moving more outputs to the right of the diagonal and thereby reducing the number of feedback loops that must be executed. Executing feedback loops increases the time and cost for completing the work. Therefore sequencing the tasks for a minimum number of feedback loops usually means achieving a task sequence that leads to the least rework, the shortest schedule and the lowest cost.
Often it is easy to get the top level summery tasks in the most efficient order even without using an N x N diagram. The value of this tool comes in sequencing lower level tasks. Once the top level tasks are sequenced then prepare N-Squared diagrams for each of the top level tasks. For example, suppose one of the top level tasks is System Trade Studies. Complex systems can have a dozen to several dozen system trades that are highly interrelated. It takes only a few hours to define the best order for the trades using an N-Squared diagram. Having just one or two tasks out of order can increase the time for completing all trades by days or even weeks.
Figure 4-2 illustrates an N-Squared diagram for the tasks defined in Figure 4-1 with task 1 sequenced to follow tasks 2 and 3. In this figure only arrows are used to indicate outputs from tasks and where the outputs are needed to make it easier to see the effects of sequencing errors. The sequence in Figure 4-2 is obviously less desirable than that of Figure 4-1 because there are multiple feedbacks, which increases the time needed to execute these six tasks compared to the time for the sequence shown in Figure 4-1.

Figure 4-2 This sequence has three outputs to the left of the diagonal compared to one for the sequence shown in Figure 4-1 and therefore takes more time to execute all six tasks.
There is a second payoff from constructing an N-Squared diagram. The form of the diagram not only defines the most efficient sequence for tasks it also shows which tasks can be conducted in parallel.  For example, note that task four has externally available input data and requires no data from any of the first three tasks. Thus the fourth task can be started in parallel with the first task, or at any time such that its output is available at the start of task five. Obviously tasks can be started as soon as the necessary inputs from earlier tasks are available and staff is available to execute the task. For example, in Figure 4-1 if there was no output from task 3 feeding to task 6 then task 6 could be executed any time after task 2 and the repeat of task 2 with data from task 3 is complete. The form of the N-Square diagram reveals immediately all tasks that can be started in parallel. Starting tasks in parallel increases the flexibility in staffing. Achieving maximum schedule flexibility, i.e. maximum lead and lag times for tasks, should be one of the goals of scheduling tasks.
To avoid the rework resulting from too much detailed task planning and scheduling in the initial project planning effort prepare second and third level N-Squared diagrams for only those top level tasks that are likely to be executed in the first two to four months of the project. Second and third level diagrams for summary tasks that are to be executed later should be developed with sufficient lead time before these tasks are to begin to allow for planning the staffing of the upcoming tasks.
Finally, N-Squared diagrams are often a very useful visual aid to communicate to customers and managers the scope and status of project work. A skilled project manager on a satellite program posted a project N-Squared diagram where it could be easily reviewed by customers and team members. He colored tasks to show task completions so that status was communicated at a glance. This gave the customers increased confidence in the project team and project management compared to just seeing schedule charts.
Developing the Schedule – This discussion assumes that those responsible for developing the schedule are familiar with both the principles of network scheduling, such as Program Evaluation and Review Technique (PERT) or Critical Path Method (CPM), and are skilled in using modern scheduling software tools. This material is not intended to teach scheduling but systems engineers need to be aware of some pitfalls in scheduling complex projects. A recommendation for the inexperienced scheduler is to study a text book on scheduling projects. James B. Dilworth’s “Production and Operations Management” contains an excellent discussion of scheduling.  Particularly important is Dilworth’s discussion of PERT using probabilistic time estimates. An alternative view of probabilistic schedules is found on the web in a blog post by Glen B. Alleman and should be studied by anyone involved in scheduling complex projects. Finally read Eliyahu M. Goldratt’s book “Critical Chain” or search “Critical Chain” on the web and read about Critical Chain Project Management (CCPM). The NASA Systems Engineering Handbook has a description of a process to develop a network schedule after finishing work flow diagrams or N-Squared diagrams. This description isn’t repeated here but a couple of comments are needed.
First, the NASA process calls for a bottom up approach; lower level tasks for subsystems or other work products are scheduled and then these groups of tasks are integrated in the scheduling tool to form the complete detail schedule. This can lead to difficulties and a lot of rework. The rework process is described in the NASA Handbook but much of the rework can be avoided by developing the detail schedule top down.
Typically projects have schedule constraints and developing the schedule bottom up leaves to the end the work of making the complete schedule comply with the constraints where it becomes complex and error prone. It is recommended that when a project has schedule constraints or when the project team wants to meet fixed dates for major milestones and deliveries then include these constraint dates on the Master schedule. Then develop the detail schedule top down from the Master schedule. Scheduling tools can combine these two schedules into what truly can be called an integrated master schedule (IMS).
The top down approach works best if the persons developing the schedule meet with those knowledgeable of the work needed at lower levels and work out the details necessary to comply with the constraints. This is time consuming but actually takes less time than it does to fix a complete schedule that doesn’t meet constraints. Plus, the bottom up approach nearly always results in having to go back to those responsible for the lower level tasks and rework the task details. This is aggravating to workers and managers.
Second, the NASA process does not discuss the variability of task durations and probabilistic scheduling that accounts for this variability. Probabilistic scheduling is most important for accurately determining the critical path. Probabilistic scheduling is discussed in a later section on critical path analysis.

Tuesday, September 28, 2010

Processes and Tools for Planning a Program - 2

Project Schedules - There are two types of schedules defined in IEEE 1220 and DoD nomenclature. One schedule is called the Master Schedule in IEEE 1220 nomenclature and the Systems Engineering Master Schedule (SEMS) or Integrated Master Schedule (IMS) in DoD nomenclature.  It is an event driven schedule and is not an executable schedule; it is used by the program management for communicating status and to guide the development of detailed executable schedules. The Master Schedule maps to the WBS, identifies major milestones and deliverables.
The second type is executable, tied to calendar dates and is called the calendar schedule. The calendar schedule is also called the detail schedule or systems engineering detail schedule (SEDS). This schedule is used to develop earned value metrics for government contracts. The NASA Systems Engineering Handbook refers only to one schedule; called the network schedule, which is the same as the detail or calendar schedule. The NASA Systems Engineering Handbook provides instructions for planning and developing the schedule whereas the DoD and IEEE 1220 documents for systems engineering only discuss the planning that systems engineers must do to enable schedules to be developed.
Three schedules are necessary to achieving effective project control and communication with management and customers. First there is the Master schedule as defined by IEEE and DoD. Some slight modifications to the DoD definition are desirable. First, limit the Master schedule to about two levels for most projects. The Master schedule can then include the major phases of the planned work, the management reviews that typically gate the initiation of the next phase and the deliverables, including any long lead items that are on the critical path, and other selected items that drive the schedule. This usually permits a Master schedule to be displayed on a single page, which greatly simplifies communications with senior management.
Second tie the events to calendar dates since most customers for new product developments specify delivery dates. The reality is that product development teams typically must plan a project that meets some schedule constraints. Customers may claim they want an event driven rather than calendar driven program but it’s rare that they actually do. Also the team has less incentive to develop work arounds to hold schedule and cost if the project is truly managed as event driven. These constraints are clear to everyone if they are included in the Master schedule. Finally, use the term Master Schedule and not the terms Integrated Master Schedule (IMS) or SEMS or SEDS. The detail schedule, or network schedule as NASA calls it, is the integrated schedule and both the Master schedule and the detail schedule apply to more than the systems engineering work.
The second schedule is the detail schedule; it is an executable schedule that is calendar driven and is used by the project management, task leaders and workers. It contains all task levels and should have measureable milestones about every one to two weeks to facilitate tracking progress. It is resource loaded, should identify critical resources and allow for contingencies, i.e. lead and lag times (float in NASA nomenclature) should be maximized as much as schedule constraints allow and the critical path should be identified.
The third schedule is a weekly task schedule prepared by each worker and used by the worker to schedule his/her work in order to meet the milestones on the detail schedule. The schedule can be on a 3 x 5 card or any other tool that the worker finds effective. This schedule must be more than a list of tasks. Workers should schedule their time hourly for an entire week at a time and with contingencies to account for the unexpected interruptions that will happen. Many experienced engineers do this automatically but young or inexperienced engineers may need mentoring before they develop the habit of scheduling by the week.
The detail schedule is a critical document to get right because it is the primary tool used to assign budgets and workers to the project and to track the work compared to planned schedule and budget. Both the Master schedule and the detail schedule must map to the Work Breakdown Structure (WBS) that assigns tracking codes to each task for the financial management system in use. The WBS should be based on the hierarchical structure of the product and processes, i.e. the Product Breakdown Structure (PBS) in NASA nomenclature, or System Breakdown Structure (SBS) in IEEE 1220 nomenclature, so that it is tied as much as possible to physical products rather than functions. Readers are referred to section 4.3 of the NASA Systems Engineering Handbook (down load from http://nen.nasa.gov/nasa_nas/ops/systems_community/NASA_SP-2007-6105_Rev_1_Final_31Dec2007.pdf) for a discussion of how to structure the PBS and WBS.
The detail schedule must have all the links and precedent relationships between tasks identified. Fortunately there are software tools, like MicroSoft Project, that facilitate preparing a detail schedule. Such tools are sophisticated and considerable experience is needed to utilize them properly. This often results in persons with skills in the scheduling tool being assigned to prepare or assist in the preparation of the schedules, which can lead to problems, as described next.
 A big mistake inexperienced project leaders make is scheduling the project before the tasks are defined. It’s ok to develop the Master schedule before defining and structuring lower level tasks that belong in the detail schedule because often Master schedules contain project constraints that must be accommodated. Inexperienced project leaders sometimes try to combine two planning steps by listing the tasks to be performed and working out a detail schedule for the list or even developing the task list on the fly using the scheduling tool. Defining tasks should be done first, at least for complex projects, because it’s not obvious how tasks should be sequenced and structured until tasks are fully defined. Defining tasks means defining the inputs, the tasks that are the sources of the inputs, the outputs and the tasks the outputs support. Defining tasks is work that requires analysis by systems engineers, design engineers and operations personnel. Just having a list of tasks does not mean that the inputs, outputs and the work needed to turn inputs into outputs are understood. It should be obvious that schedules constructed without such understanding are not likely to be executable without numerous corrections.
Another big mistake inexperienced project leaders often make is requiring detailed schedules for entire projects as part of the beginning planning. This is a mistake because there is insufficient information to construct such detailed schedules so that a detailed schedule becomes useless within a month or two and re-planning is required.  A rolling wave scheduling process that avoids this needless rework is described after discussing tools for defining tasks.

Wednesday, September 22, 2010

Processes and Tools for Planning a Program - 1,

The first activity for systems engineers on a new product development program is to assist in planning the program. Although planning a program is the responsibility of the program leadership a product development program cannot be properly planned without systems engineering work. Program planning involves defining the tasks to be performed, scheduling the tasks and developing the planning documentation needed to guide the work and the workers. One of the primary reasons product development programs fail to achieve the expectations of management and customers is poor planning. This chapter presents processes and tools that reduce the chances that a product development fails to meet expectations due to poor planning.
This chapter discusses the various plans and documentation making up a product development plan, scheduling the development and touches on the important program management issues of design reviews and supplier relationships that involve systems engineering. This chapter does not distinguish whether systems engineering or program management is responsible for any specific plan item. That decision is up to the development team management. Allocating budget for each task and assigned people to each task are additional planning functions that are not treated here as these activities usually don’t rely on systems engineering other than for estimating the cost of the systems engineering work.
Product development programs are called projects here even though the term projects refer to both product and service developments. The planning for a new product or service development is similar so there is no reason to restrict this chapter to products; besides project is a shorter term than product development program.
Planning Documentation
Documentation is an integral part of project planning. Although not many projects fail due to poor documentation good planning documentation makes a project easier to manage and easier for the workers assigned to the project. Four types of documentation that are typically used on complex projects are discussed. These are the Integrated Management Plan (IMP), the Schedules, the Systems Engineering Management Plan (SEMP) and the System Design Document (SDD). The first three comprise the top level planning documentation. Of course there is considerable documentation needed to back up these top level plans. The SDD is not strictly a planning document but it should be started during the planning phase.
There are two ways to produce poor documents and one way to produce good documents. Poor documents are either so brief or poorly written that there is little useful information for managers overseeing the project and new workers assigned to the project or the documents are so long and detailed that no manager and few workers will ever read them. Surprisingly, most bad documents are those that are far too long to be useful. This is because the project leaders have slavishly followed advice to include everything but the kitchen sink description in these documents.
In the an earlier post it was stated that where ever possible labeled graphical models should be used rather than textual documents. Plans are one of the areas that require a significant amount of text. However, the goal should be to make as much of the plans as possible graphic models such as diagrams and tables. (Tables are included as graphic models here because they are less ambiguous than pure text.)
The Integrated Management Plan - A concise IMP is preferred because the IMP should be viewed as a “contract” between the project team and their senior management. Therefore the document need only address issues at a summary level. This allows the team and management to focus on the important issues without getting mired in detail. Mature organizations have standard procedures and processes for items like configuration management and product assurance. Management needs to know if any tailoring is needed for standard processes but they don’t need to wade through the details of standard processes. Certainly documents like a Product Assurance Plan are necessary but hopefully the organization is mature enough that the plan for any specific project is a tailored version of a standard plan.  Summarizing how the plan is tailored to the specific project is sufficient for the IMP. Any manager or worker that needs to know the details can read the detailed plan.
A good IMP is about ten pages long or less. If it is any longer it won’t be read by managers who are expected to have oversight of the project or by few workers that are assigned to the project. It is quite difficult to cover all the items that are recommended for an IMP in ten pages but it is far better to put effort into a good ten page document than to put even more effort into 80 pages that are never read. A template is provided here for a ten page IMP. Many books and web sites advise far more material be included in an IMP but it’s not effective to produce such tomes and it costs precious time and money to produce them. If a project leader insists that all the detail is needed then include a seven to ten page Introduction and Summary for managers because that is all they are likely to read.
The table shown here is an outline for a seven to ten page IMP. Your project may not have the same required items but this outline illustrates that a useful IMP can be ten pages or less. The suggested number of pages in this table adds to ten pages if the maximum suggested amount is used for every item. The recommended topics provide managers a concise overview of a project and are sufficient to orient new workers assigned to the project. If the resulting IMP is well written then, together with the project schedules, it provides senior managers all the information they need to conduct oversight that ensures that the project is progressing adequately or that the project leaders need help. New workers do need additional information but that is better provided in the SEMP and SDD.
Topic
Number of pages
Program Overview (Milestones, Deliverables with quality level required, Fit with Strategic Goals and a one page Top Level Schedule)
1.5 to 3 pages
Technical Description of System (Intended function, hardware/software overview and any make/buy issues)
1 to 2 pages (Include a top level System Breakdown Structure (SBS) and link to more detailed breakdowns in the SEMP.)
Key Performance Characteristics
0.25 to 0.5 pages (Include links to a Specification document for those needing more detail.)
Work Breakdown Structure (WBS)
1 page of top level only (Put the detail, if needed, in an appendix or link to a separate document, e.g. the SEMP.)
Cost target, Preliminary budget & Sources of funding
0.25 page
Staffing Plan (Preliminary manning forecasts, any critical resources, & any teaming arrangements)
0.25 to 0.5 pages
Key Assumptions
0.25 to 0.5 pages
Summary of major risks and plans to mitigate
0.25 to 0.5 pages and reference a risk register in an appendix
Inter-project cross feeds and dependencies
0.25 page
Capital and facility requirements
0.25 to 0.5 page
Status of Preliminary Support Plans (Configuration Mgmt. Plan, Product Assurance Plan, Environmental Health and Safety Issues/Plans, Logistics and Field Support, etc.)
0.5 to 1 page (Which are standard and which are to be tailored. Say why tailoring is appropriate.)
If an enterprise accepts the definition of the IMP as a contract between the project team management and the enterprise management then there is no reason that the IMP always be a text document. It may be acceptable that the IMP is a set of briefing charts that the team presents to the management and receives acceptance or guidance from the management at the end of the briefing. Since most briefings today use electronic data projected on a screen it is easy to include links to the more detailed plans just in an electronic text document. Including appropriate links to more detailed planning documents makes the briefing charts as complete as any text document.
There are several advantages to this approach. First, it is easier to prepare a set of briefing charts covering the topics of an IMP than it is to write a high quality document. Second, if the team can get the management to set through a briefing then there is no question about whether the management has read the IMP and there should be no question about whether the IMP is approved or not. Also, a briefing allows any ambiguities to be resolved in real time. Finally, the 80 page tome is discouraged because senior management isn’t likely to sit through a briefing that long.
A last but important reminder is to prepare the IMP using an IMP from a previous project as a template and strive to make the new IMP an even better template for future IMPs. This advice isn’t limited to the IMP. Where ever possible look for opportunities to build on previous work and structure work so that the result makes future work easier and faster. This approach to fundamental to executing systems engineering rapidly and accurately.