The collection of blog articles posted on this site is now available in book form for $19.50. You can order it from Create Space or from Amazon . The book includes edited versions of the blog articles plus other typical features of a book such as a table of contents and index. The title of the book is Modern Methods of Systems Engineering: With an Introduction to Pattern and Model Based Methods.
You can learn more about the book and the authors at our web site. Our plan is to add additional material to this blog as the authors feel it can contribute to systems engineering methods. This material will be added as it is available rather than on a regular weekly basis. The authors welcome comments on any of the blog articles and corrections, suggestions or other comments on the book. If any readers have material they feel contributes to systems engineering methods that isn't covered in the book please contact us via a comment and we will consider adding your material to this blog.
Saturday, December 10, 2011
Monday, October 24, 2011
12.3 Return to Chief Designer Model
Implementing ICE allows system development teams to function similarly to the model of chief designer and draftsman/assistant team popular before the emergence of modern complex systems in the 1960s. The large screen displays in a design command center and the supporting analysis models and simulations bring design information to the lead systems engineer with very little information latency. The lead systems engineer in a design session can interact with the design team just as a chief designer interacted with the draftsman/assistants in former times. This may be as near to the efficiency of the “craftsman” model as can be expected for the development of complex systems. Lead systems engineers can be empowered to function as chief designers for the systems engineering work in a mature ICE environment supported by comprehensive analysis, modeling and simulation tools. The lead systems engineer can be empowered to function as the chief designer for the entire development cycle if supported by specialist chief designers who are responsible for the electrical design, the mechanical design, etc.
Implementing ICE with an overall chief designer and supporting specialty chief designers for each IPT allows interleaving IPT design sessions with SEIT design sessions so that the desired iteration between levels of design and the coordination between IPTs necessary to maintain balance in the design can be achieved and the schedule for the development is likely to be significantly reduced.
The actual times it takes for the planning and for the documentation and analysis periods are highly dependent on the sophistication of the tools used by the design team. If pattern based systems engineering is used and if the team’s modeling and simulation tools are extensive and mature then the planning and the documentation/analysis periods may be possible to be integrated into the design sessions so that the design work becomes a continuous series of three to four hour intense design sessions in the design command center followed by a day or two of planning/documentation/analysis, followed by another design session. Alternatively, the team may be organized with design specialists and documentation specialists. The design specialists conduct analysis, modeling and simulations to determine design parameters. The documentation specialists capture the design parameters and product the necessary specifications, drawings and CDRLs while the design specialists are generating the next layer of design parameters.
12.4 Integrating Modern Methods
The 21st century brought new constraints to system development:
- Customers and global competition are demanding faster and cheaper system development
- Skilled engineers are retiring faster than replacements are experienced enough to replace them
- Development teams are spread across multiple sites and multiple organizations.
This new century has also brought new tools for system development:
- Fast internet and intranet connections provide real time communication across multiple sites
- Relatively cheap but powerful computers and network communication tools
- Model based and Pattern Based Systems Engineering processes
- Powerful CAD tools
- Maturing integrated design and design documentation processes
- Some integrated design and manufacturing tools
- Potential for end to end documentation management
The question for systems engineers is how to use the new tools to relieve the new constraints.
One answer to this question is to integrate the methods described in this and previous chapters with disciplined execution of the traditional fundamentals of the systems engineering process.
Figure 12-4 illustrates methods that can be synergistically integrated to achieve reductions in design time of factors of three to ten and cost reduction by factors of two to three. These benefits are not achieved instantly. Training is needed for teams to use these methods effectively. Investment is necessary to achieve the best results of PBSE and to push patterns down from the system level to subsystem and assembly levels. Ongoing investment is necessary to maintain the modeling, simulation, software development and CAD/CAM tools required to remain competitive. Document generation and document management tools are likely to require investments and training to effectively reduce engineering effort. Finally it must be recognized that systems engineering is going to continually evolve by inventing new processes and tools and by introducing new methods and tools for executing current processes.
The rapid introduction of new tools and processes in the past two decades have increased the fraction of a systems engineer’s time that must be spent in training and self-study in order to maintain required skills. This is likely to continue. The increases in complexity of new systems are also likely to continue and these complexity increases may require more sophisticated systems engineering processes than available today. Hopefully new methods and tools will be developed that can handle increased system complexity and the increases in productivity from using new methods are enough to make time available for the training and self-study systems engineers will need.
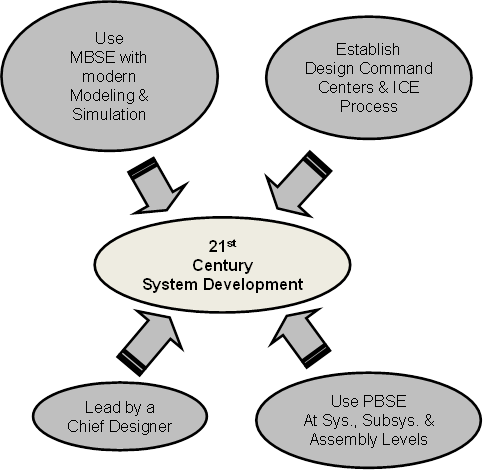
Figure 12-4 The methods described in this book can be integrated to provide a robust approach to system development that can achieve dramatic reductions in cost and design time.
Tuesday, October 18, 2011
12.2 Integrated Concurrent Engineering (ICE) for Small Teams
The ICE approach described in Section 12.1.1 and 12.1.2 applies to teams of 15 to several hundred people; assuming the large teams are organized into smaller IPTs of 10 to 25 people. The design command centers can be shared by many individual teams on a development project because each team uses the center for only a half day at a time and for only three to ten days a month typically. Some system developments can be accomplished with smaller teams of five to ten people. Whereas small teams can also use the same design command center and concept of operations as larger teams an alternative approach may be even more efficient.
Work spaces for most organizations use individual cubicles or cubicles shared by two or three people. Most of these work spaces are modular and can easily be reconfigured. For example suppose a project has six or seven workers each in his/her cubicle. Typically, workers are assigned cubicles without consideration of where others working on the same projects are located. Much of the communication takes place via emails or periodic meetings in a conference area. Figure 12-3 shows how a space of eight cubicles can be rearranged to colocate seven workers and a conference table. Collocating workers as shown in Figure 12-3 enables continuous face to face interactions to replace emails and periodic meetings in conference rooms. Research has shown that problems are solved much faster by groups communicating face to face compared to groups communicating via email. That is to be expected because the information latency in face to face communications is almost instantaneous whereas it is many seconds or even hours with email.
It increases productivity to have two workers with related skills close enough together that they can see each other’s computer screens and discuss what is on the screen without moving from their work positions. Examples include mechanical and thermal engineers or mechanical engineers and designers skilled in mechanical CAD tools that are supporting the engineers.
If the team leader is collocated with the rest of the team so that he/she can facilitate an ICE process then dramatic reductions in project cost and design time should be realized just as it is for larger teams using ICE. A caution is that team dynamics are more important for collocated teams than for teams in individual cubicles. Teams must be comprised of individuals who work well together or else productivity suffers. Workers who perform better as individual contributors are likely better left in their own cubicle. It is also advisable to provide training so that the workers understand why they are being asked to give up the privacy of individual cubicles.

Tuesday, October 11, 2011
12 Integrating Modern Methods for Faster Systems Engineering
12.0 Introduction
In chapter 2 it was explained that the best model for system development is the “craftsman” model that was widely used before systems became so complex that a single chief engineer could no longer understand a system in sufficient detail to control all aspects of design. System engineers, design engineers and other specialty engineers became necessary to handle the complexity of modern systems. Although this new approach has enabled the development of very complex modern systems it takes much longer to develop a system now than it used to take when a chief engineer and his/her team could develop a new system in a few months.
One objective of this book is to introduce new methods that enable the systems engineering work on system development to be accomplished faster and more accurately. This book has an emphasis on systems engineering fundamentals, as described in the DoD SEF and the NASA SE handbook, and readers will note that it takes time and discipline to follow these fundamental processes. Complex systems cannot be developed cost effectively by shortcutting the systems engineering fundamentals; what is necessary is faster and more accurate methods for executing these fundamentals. Accuracy is required because any errors in systems documentation results in costly “find and fix” efforts later in design or in integration and test. Several methodologies for ensuring accuracy have been discussed including using graphical models in place of text as much as possible, employing redundant tools for developing documentation, using modeling and simulation to support requirements analysis as well as design and checking work at the three levels of worker checking his/her work, peer reviews and design reviews.
In chapter 5 pattern based systems engineering was introduced, which when properly implemented, can dramatically reduce the time to produce much of the top level systems engineering documentation and at the same time increase the accuracy of requirements definition. Similarly using validated system performance models and simulations throughout the development cycle aids in reducing development time and increases the accuracy of requirements and design concepts and the robustness of systems.
The objective of this chapter is to describe methods for reducing information latency and then to show how integrating modern methods can achieve greatly reduced time for systems engineering work without sacrificing any process fundamentals critical to the accuracy of this work. Information latency is the time between when information is generated and the time it is available to others who are depending on the information for the next steps in their work. Information latency was increased with the evolution from the craftsman model for product development to models with systems engineers; this is the primary reason modern systems take so long in development. Reducing information latency to levels near what it was for the craftsman model is a necessary step in achieving faster system development cycles.
12.1 Integrated Concurrent Engineering
In the 1990s a method emerged for reducing information latency for system development teams. This method is similar to methods used previously when teams of workers were brought together in a common work area to collaborate to quickly accomplish some project. Many organizations in the aerospace and defense industry use special work areas to collocate the people writing and publishing proposals, which are often highly time constrained projects. The use of proposal preparation rooms with personal dedicated to working in these rooms results in highly productive teams for the limited times involved in typical proposal efforts. A major part of the increased productivity is due to the reduction in information latency achieved by having workers so close they can ask questions of one another and get immediate answers. If teams tried to maintain such intense work over long periods productivity would taper off due to workers being unable to maintain the long hours and intense work without burnout.
The methods that evolved in the 1990s achieve the reduction in information latency and the associated productivity gains of the colocated teams and permit teams to work effectively for long periods without burnout. These methods became possible by exploiting new technology as well as new work management methods.
The availability of inexpensive large screen display projectors, n to one video switches and inter/intra nets makes it cost effective to set up special work rooms where teams of 10 to 25 knowledge workers can gather with their laptops and software tools. These teams can simultaneously work and share the work results with the entire team on the large screen displays as fast as the results are available. Many organizations now use such facilities for teams to gather for intense work and information sharing periods of three to four hours two or three times weekly. These sessions must be well planned and workers must come prepared to work and share results in real time. Planning, documenting work and time consuming tasks are performed in between the sessions in the special work rooms. This approach is called by a number of names but Integrated Concurrent Engineering (ICE) is a common name. This approach is effective because it reduces information latency from minutes to seconds or hours to minutes.
ICE is proven to reduce cost and schedule of complex projects by factors of three to ten 12-1, 12-2. Neff & Presley 12-3 reported that the Jet Propulsion Laboratory initially achieved an average of over 80% reduction in project costs and significantly improved the quality and speed of work. With more experience a 92% reduction in design time and a 66% reduction in cost was reported. Designs produced using ICE are of higher quality because they examine each option in greater detail earlier in the design process by sharing thousands of design variables in real time. Approaches that are proven to reduce cost and schedule by factors of three to ten and increase quality at the same time should not be dismissed by organizations that wish to remain competitive.
The benefits of ICE are better understood by examining the work space and the work process in more detail. There is no single best work space design or work process; each organization tailors both to their views and their business processes. Examples presented here are guidelines for understanding ICE and not necessarily the best for any specific organization.
12.1.1 The ICE Design Command Center- A schematic diagram of a small ICE work area is shown in Figure 12-1. The room has large screen displays located where they are visible to everyone in the room. Several displays are used so that several different types of information can be displayed simultaneously. Each skill cluster has workers with common specialties and each worker has computer equipment and the design, modeling and simulation tools associated with his/her specialty. Alternatively each cluster can be an IPT responsible for a segment of the system design. Each of the computers is connected to one of the large screen displays via a video switch so that the results of analysis, modeling or simulation can be shared with everyone in the room on one of the large screen displays. The facilitator, typically the lead systems engineer for the systems engineering phase of development, is responsible for maintaining the design baseline visible to all at all times and to lead the team through a preplanned sequence of analysis tasks that lead to design decisions in real time.

12.1.2 The ICE Concept of Operations - Integrated Concurrent Engineering is a repeating series of planning sessions followed by team work sessions, followed by documentation and follow-up analysis in parallel with the planning for the next series of team work sessions. The times for each of the components of the ICE cycle are dependent on the type and complexity of the system being developed. Example times are given here to explain the concept of operations. Development teams are likely to find adopting this concept of operations to their systems development requires adjustments. A typical approach is illustrated in Figure 12-2 where a series of three plan/ meet/document sessions are shown and each of the meet or design sessions is comprised of three intense team sessions separated by a day or two. Individual design sessions may last from two to four hours.

The planning, indicated by A in Figure 12-2, is done by team leaders and might take a week to plan a series of three intense work sessions, indicated by B, over another week period. The series of work sessions is followed by perhaps two weeks of documenting work done in the design sessions and carrying out analyses that takes too much time to be done in design sessions. In the example shown in figure 12-2 nine intense design sessions are planned, executed and documented in a an eight week period. Note that since the design sessions are the only activities that require the ICE design command center such a center can support three or four ICE projects or separate IPTs of a large project concurrently.
12-1 The Integrated Concurrent Enterprise by David B. Stagney, MIT Department of Aeronautics and Astronautics, Sloan School of Management, August 13, 2003
12-2 Observation, Theory, and Simulation of Integrated Concurrent Engineering by John Chachere, John Kunz, and Raymond Levitt, Center For Integrated Facility Engineering, Working Paper #WP087, Stanford University, August 2004
12-3 Implementing a Collaborative Conceptual Design System
– The Human Element is the Most Powerful Part of the System by Jon Neff and Stephen P Presley, IEEE, 2000.
Tuesday, October 4, 2011
11.3 Creating an Executable Model
(I apologize but the formatting problems continue.)
Several companies have tools available that allow for modeling systems using UML (or SysML) diagrams. These companies include EmbeddedPlus Engineering11-7, Vitech and IBM© under their Rational© product suite. The tools support the modeling language semantics so the engineer can focus on creating the design of the system and not on the accuracy of the diagrams per the modeling language specifications.
Vitech supports the following UML diagram types in their CORE11-8 Software:
· Activity
· Sequence
· Class
· Package
· Use Case
IBM Rational supports the following UML diagram types in their Statemate11-9 product:
· Use Case
· Sequence
· State Machine
Using a standard development process, these tools are used from requirements down to executable software. Benefits from creating an executable model include verifying completeness and correctness of the system and bridging the gap between the systems engineering functional domain to the Object-Oriented Software Engineering domain. The models are not just done at the beginning of system definition, but evolve as the development process progresses until there is executable software. The SysML Forum, http://www.sysmlforum.com/, provides an overview of possible SysML tools that can be used for creating an executable model.
12.4 Benefits and Limitations of UML
Benefits 0f using UML when defining a system include:
· Standardized (by OMG Group), not proprietary
· Common language for communicating
· Explained and described in every aspect by vast amount of publications, resources, textbooks, etc.
· Can be customized and extended for specific application domain, software process, or implementation platform
· Uses object oriented design concepts
· Independent of specific programming language
SysML benefits include:
· Requirement modeling support provides the ability to assess the impact of changing requirements to a system’s architecture
· Precise language, including support for constraints and parametric analysis that allows models to be analyzed and simulated, greatly improving the value of system model compared to textual system descriptions
· Open standard
Whereas UML has many benefits, it also has limitations:
· Still no specification for modeling of user interfaces
· Poor for distributed systems – no way to formally specify serialization and object persistence
· Requires training/certification
· Specification is large and takes time to understand
· Can’t describe relationships between complex system composed of both hardware and software
12.5 Where to Find More Information on UML (SysML)
To learn more about SysML and the different diagrams, please see http://www.omgsysml.org/INCOSE-OMGSysML-Tutorial-Final-090901.pdf
There are many available resources on UML both in book form and on the internet. Beneficial books include:
1. Systems Engineering with SysML/UML: Modeling, Analysis, Design by Tim Weilkiens
2. Model-Based Development: Applications, by H. S. Lahman
3. Using UML: Software Engineering with Objects and Components, by Perdita Stevens
4. Software Modeling and Design: UML, Use Cases, Patterns, and Software Architectures, by Hassan Gomaa
5. UML for Real: Design of Embedded Real-Time Systems, by Luciano Lavagno, Grant Martin and Bran V. Selic
6. Model-Driven Development with Executable UML (Wrox Programmer to Programmer), by DraganMilicev
7. UML 2.0 in a Nutshell, by Dan Pilone and Neil Pitman
8. SysML for Systems Engineering (Professional Applications of Computing), by J. Holt and S. Perry
9. Writing Effective Use Cases, by Alistair Coburn
10. Software for Use: A Practical Guide to the Models and Methods of Usage-Centered Design , by Larry L. Constantine and Lucy A. D. Lockwood
11. Use Case Modeling , by Kurt Bittner and Ian Spence
12. Scenarios, Stories, Use Cases: Through the Systems Development Life-Cycle, by Ian Alexander, Neil Maiden
13. Use Case Driven Object Modeling With UML: Theory And Practice, by Doug Rosenberg, Matt Stephens
Beneficial web sites include:
6. OMG Systems Modeling Language Tutorial, http://www.uml-sysml.org/documentation/sysml-tutorial-incose-2.2mo
7. An Introduction to Systems Engineering with Use Cases, by Ian Alexander and Thomas Zink, http://easyweb.easynet.co.uk/~iany/consultancy/use_cases/use_cases.htm
8. Visual Paradigm, http://www.visual-paradigm.com/product/vpuml/provides/umlmodeling.jsp?src=google&kw=use%20cases&mt=p&net=s&plc=&gclid=CJSQzqzNkqgCFYi8KgodmmeJCw
9. SmartDraw, http://www.smartdraw.com/specials/ppc/softdesign.htm?id=10514&gclid=CNSquMTNkqgCFcW5KgodrHR2Dg
References
11-1 Model-based Systems Engineering (MBSE) Initiative, by Mark Sampson and Sanford Friedenthal, Presented at the Opening Plenary of the International Workshop, Phoenix, AZ, 29 January 2011; http://www.omgwiki.org/MBSE/lib/exe/fetch.php?media=mbse:mbse_iw_2011_intro-b.pdf
11-2 Foundational Concepts For Model Driven System Design by Loyd Baker, Paul Clemente, Bob Cohen, Larry Permenter, Byron Purves, and Pete Salmon, INCOSE Model Driven System Design Interest Group
11-3 The Unified Modeling Language User Guide, by Grady Booch, James Rumbaugh, and Ivar Jacobson, Addison-Wesley Professional; 2 edition, May 29, 2005
11-4 Unified Modeling Language Tutorial, http://atlas.kennesaw.edu/~dbraun/csis4650/A&D/UML_tutorial/activity.htm
11-5 Object-Oriented Development in an Industrial Environment, Ivar Jacobson, Proceedings of OOPSLA´87, SIGPLAN Notices, Vol. 22, No. 12, pages 183-191, 1987
11-6 Object-Oriented Software Engineering: A Use Case Driven Approach, by Ivar Jacobson, Magnus Christerson, Patrik Jonsson, and Gunnar Övergaard, Addison-Wesley, Wokingham, England, 1992.
Tuesday, September 27, 2011
11.2.3 Behavior Diagrams
(Apologies for the formatting problems in this posting. The editor is scrambling the input formats and won't change.)
Three of the eight behavior diagrams are discussed with examples in this section.
Activity Diagram - An activity diagram shows the flow from activity to activity within a system. An activity shows a set of activities, the sequential of branching flow from activity to activity, and objects that act and are acted upon. Activity digrams are used to illustrate the dynamic view of a system and are important in modeling the function of a system. Activity digrams essentially are flow charts and emphasize the flow of control among objects. Figure 11-4, shows a possible activity diagram for Taking a Picture in the digital camera system.

Figure 11-4 Example Activity Diagram for a Digital Camera System
Activity diagrams can also include forks to describe conditions and parallel activities. A fork is used when multiple activities are occurring at the same time. As shown on the diagram , all branches at some point are followed by a merge to indicate the end of the conditional behavior started by that branch.
Activity diagrams should be used in conjunction with other modeling techniques such as sequence diagrams and state machine diagrams. The main reason to use activity diagrams is to model the workflow behind the system being designed. Activity Diagrams are also useful for: analyzing a use case by describing what actions need to take place and when they should occur; describing a complicated sequential algorithm; and modeling applications with parallel processes11-4. Software engineers have also found them to be useful for scientific software development.
Sequence Diagram - A sequence diagram is an interaction diagram that emphasizes the time ordering of messages. A sequence diagram shows the objects and the messages that go between those objects at a particular instance of time. They are used to illustrate the dynamic view of a system. An example of a possible sequence diagram for the digital camera system is hown in Figure 11-5.

Figure 11-5 Example Sequence Diagram for a Digital Camera System
As shown in the diagram, an object has veritical lines called lifelines which represent the existence of an object over a period of time. The stick figure represents an actor, the Picture Taker. The messages become method calls when translated into executable software. The focus of control represents the period of time during which an object is performing an action directly or through a subordinate operation. Other graphic elements used in a sequence diagram can be found in the UML specification at http://www.omg.org/technology/documents/modeling_spec_catalog.htm#UML
Sequence diagrams can be used at all levels of defining a software system – Use Cases down to a detailed software function. Although sequence diagrams are typically used to describe object-oriented software systems, they are also extremely useful as system engineering tools to design system architectures.
State Machine Diagram - A state machine is a behavior that specifies the sequence of states an object goes through during its lifetime in response to events, together with its response to those events. A state machine diagram shows the state machine, consisting of states, transitions, events, and activities. These diagrams are used to illustrate the dynamic view of a system. These are important when modeling the behavior of an interface, class, or collaboration and are useful when modeling reactive systems. Figure 11-6 shows a state machine diagram for the Shutter Object. When the button on the camera is pushed to take a picture, the Shutter object moves from the Opened state to the Closed state. Once the button is released, the Shutter Object moves back into the opened state.

Figure 11-6 Example State Machine Diagram for a Digital Camera System
Note that a transition from one state to another could be a signal, an event, a change in some condition, or the passage of time. A state machine diagram may have a transition back to its own state. At its simplest, an object within a software system has two states, idle or running. When defining a software system, state diagrams are very beneficial for defining complex objects and how they behave.
Use Case Diagram – A Use Case Diagram is a diagram that shows a set of use cases and actors and their relationships. A Use Case is a description of a system’s behavior as it responds to a request that originates from outside of that system. It provides context to what is within a system and what interacts with a system and defines the behavior of the system when it receives external stimuli (i.e. the goals of the system). A system is made up of multiple Use Cases to define the behavior of the overall system. Use Cases were first defined in 1987 at the Proceedings of OOPSLA11-5 by Ivar Jacobson for use in Software Engineering to define functional requirements. Ivar Jacobson, et al, later published a book titled Object-Oriented Software Engineering: A Use Case Driven Approach in 199211-6 based on his experiences with Use Cases while working on large telecommunications systems. Figure 11-7 shows a Use Case Diagram for the simple Digital Camera System.

Figure 11-7 Example Use Case Diagram for a Digital Camera System
The Picture Taker and the Printer are outside the boundary of the system being defined and are called Actors. Take Digital Picture, Print Picture, and Delete Picture are all use cases within the system (i.e. functions the Digital Camera performs). When developing Use Cases, all Actors are described as “nouns” while the Use Cases are “verb phrases” that describe an action the system performs. The arrow on the association line indicates initiation of interaction. If either the Use Case or the Actor can initiate interaction, then there is no arrow on the relationship line. There can be two types of actors depicted on a Use Case diagram: Primary Actors which benefit from the Use Case (arrow from Actor to Use Case) and secondary actors which participate in the system but don’t get benefit (arrow from Use Case to Actor).
Use Case modeling not only includes the model, but also written text to describe how the system behaves when the external Actor stimulates the system. Typically a Use Case template is defined so all needed information is captured on how the system behaves. One example of a Use Case template for capturing the behavior of a system is shown in Figure 11-8.

When starting Use Cases, it’s advisable to keep the description at the top-level at first and add details as the Use Case is better understood. Typically a Use Case is started with the normal flow of events; alternate and exception paths are added if needed. One of the strengths and a significant benefit of Use Cases is that it makes engineers think about how they want the system to behave under abnormal or failure conditions.
11-5 Object-Oriented Development in an Industrial Environment, Ivar Jacobson, Proceedings of OOPSLA´87, SIGPLAN Notices, Vol. 22, No. 12, pages 183-191, 1987
11-6 Object-Oriented Software Engineering: A Use Case Driven Approach, by Ivar Jacobson, Magnus Christerson, Patrik Jonsson, and Gunnar Övergaard, Addison-Wesley, Wokingham, England, 1992.
Tuesday, September 20, 2011
11.2 Introduction to the Unified Modeling LanguageTM(UML®)1
The Unified Modeling Language is a language used to specify, visualize, and document models of software systems, including their structure and design. The language was formed by Grady Booch, Ivar Jacobson, and James Rumbaugh11-3 after a critical mass of ideas started forming in the 1990s from their individual work in object-oriented methods. Collectively they defined UML for three reasons:
1. Their methods were evolving toward each other independently
2. To provide stability to the object-oriented modeling language
3. To provide improvements to the language
UML 1.0 was offered by the Object Management Group (OMG) for standardization in January 1997 with the final acceptance of version 1.1 in September 1997. The OMG maintains the UML specification with the latest version found on the OMG website at http://www.uml.org/
In March 2003, the OMG along with the International Council on Systems Engineering (INCOSE) developed a Request for Proposal (RFP) for UML for Systems Engineering. The RFP specified the requirements for extending UML to support the needs of the systems engineering community. SysML™[1] is a general purpose graphical modeling language for specifying, analyzing, designing and verifying complex systems. The system may include hardware, software, information, personnel, procedures, and facilities. SysML represents a subset of UML. The SysML specification was developed with the OMG announcing the adoption of the OMG SysML in July 2006 and the availability of the specification in September 2007. The latest version of the SysML specification can be found at the OMG website at http://www.omg.org/spec/SysML/
11.2.1 Types of Diagrams in the UML- UML 2.4 See (http://www.omg.org/spec/UML/2.4) defines fourteen types of diagrams, divided into two categories:
1. Structure Diagrams, which include:
a. Class Diagram
b. Package Diagram (diagram same for SysML)
c. Object Diagram
d. Component Diagram
e. Composite Structure Diagram
f. Deployment Diagram
2. Behavior Diagrams, which include:
a. Activity Diagram
b. Sequence Diagram (diagram same for SysML)
c. Communication Diagram
d. Interaction Overview Diagram
e. Timing Diagram (optional)
f. Interaction Tables (optional)
g. State Machine Diagram (diagram same for SysML)
h. Use Case Diagram (diagram same for SysML)
Structure diagrams are used to visualize, specify, construct and document the static aspects of a system i.e. no time element). Behavior diagrams are used to visualize, specify, construct and document the dynamic aspects of a system (i.e. time is considered).
Not all diagrams in each category need to be used when defining a software system, just what is needed to communicate how the software system works; how it is built structurally, how it behaves, and what it interacts with. Without both category representations, a software system is not fully defined and can lead to issues when the software system is built. For example, without understanding the timing requirements for a real-time embedded system, software designers may define the software structure to meet all functional requirements of the system, but find out during testing that it does not meet the timing requirements. The software system would need to be re-architected to meet both the functional and timing requirements.
The next sections provide simple examples of some of the UML diagram types including common diagrams with SysML. These are simple examples based on the Digital Camera System first introduced in Chapter 6. Note that the examples are not meant to represent a complete Digital Camera System or to be 100% accurate. They are just representative of the UML diagrams to help understand the basic structure and information they are conveying. There are many books that provide more detailed instructions on how to create these diagrams and on what they are used for when modeling a software system. There are also many Web Sites that provide examples of each diagram type.
11.2.2 Structure Diagrams- Examples of Class Diagrams, Package Diagrams and Deployment Diagrams are Structure Diagrams shown and discussed in this section.
Class Diagram - A class diagram is used to show a set of classes, interfaces, and collaborations and their relationships. Class diagrams provide a static view of the system. Using the Simple Digital Camera System, Figure 11-1 illustrates a possible class diagram based on Take a Digital Picture Use Case .

Figure 11-1 Class Diagram Example for a Simple Digital Camera System
Shutter, LCD, and Storage are all classes within the system that interact with each other and represent real world items that make-up a Digital Camera. Each class contains attributes and operations. Attributes are a named property of a class that describes a range of values that instances of the property may hold; using software terms, a data structure or a variable. An attribute is some piece of information the class needs in order to perform its function. A class may have any number of attributes or none at all. The class Storage has an attribute of imageCount to keep track of the number of images stored and it has three operations indicated, storeImage, incrementImageCount, and isStorageAvailable.
When first identifying classes within a system start with the requirements specification or Use Cases and identify nouns. Alternatively, start with the real world items that make-up the system. All of these are candidates for possible classes. As more is understood about the system, the class diagrams will evolve until the final class diagram for the system is achieved. In modeling a software system, the classes tend to become more abstract and may not have real world counterparts.
The example above does not contain all possible graphic elements that are possible in a class diagram. For more information, see the UML specification at: http://www.omg.org/technology/documents/modeling_spec_catalog.htm#UML
Package Diagram- A package is a general-purpose mechanism for organizing elements into groups. Or in other words, it indicates a subsystem or block of functionality within a system and is used to simplify the view of a system in order to understand it better. Figure 11-2 shows a possible package diagram for the Digital Camera System.

Figure 11-2 Package Diagram Example for a Simple Digital Camera System
The package diagram also shows the interactions or relationships between each package. Figure 11-2 illustrates the Camera Controller Package as a depdency on both the Image Acquisition Package and the Storage Device Package. Since packages are a way of abstracting or simplfying the view of a system, each package may contain more packages, class diagrams, use cases, components, etc. until the view is at the lowest level. Well-designed packages group like elements that tend to change together. Well-structured packages are loosely coupled and highly cohesive (See Section 6.6.3 for definitions of coupling and cohesion). The graphic elements used in class diagrams to show relationships are also used in package diagrams. Package diagrams are used to show different views of a system’s architecture.
Deployment Diagram - A deployment diagram shows the configuration of run time processing nodes and the components that live on each node. They are used to illustrate the static deployment view of a software system onto the hardware on which the system executes. Names of the nodes should represent the vocabulary of the hardware in the domain of the system being developed. Nodes represent a physical element and represent a computational resource having at least some memory and processing capability. Figure 11-3 shows a deployment diagram for the Digital Camera System assuming there are three processors in the system.

Figure 11-3 Example Deployment Diagram for a Digital Camera System
For real-time embedded software with only one processor, the deployment diagrams look like context diagrams from the system engineering world. They show the devices with which the processor board is interacting using what are called stereotypes to identify the hardware components. Client/Server and Distributed software systems have more processors on their deployment diagrams and provide the designers with an understanding of where each software component resides on the physical hardware.
The relationships between nodes are typically an association that represents a physical connection (i.e. Ethernet, cPCI bus). For more information on possible types of relationships for deployment diagrams, see the UML specification at: http://www.omg.org/technology/documents/modeling_spec_catalog.htm#UML
[1] Systems Modeling Language and SysML are either registered trademarks or trademarks of Object Management Group, Inc. in the United States and/or other countries.
Subscribe to:
Posts (Atom)