Search This Blog

Showing posts with label Systems Engineering Process. Show all posts

Monday, October 24, 2011

12.3 Return to Chief Designer Model

Implementing ICE allows system development teams to function similarly to the model of chief designer and draftsman/assistant team popular before the emergence of modern complex systems in the 1960s. The large screen displays in a design command center and the supporting analysis models and simulations bring design information to the lead systems engineer with very little information latency. The lead systems engineer in a design session can interact with the design team just as a chief designer interacted with the draftsman/assistants in former times. This may be as near to the efficiency of the “craftsman” model as can be expected for the development of complex systems. Lead systems engineers can be empowered to function as chief designers for the systems engineering work in a mature ICE environment supported by comprehensive analysis, modeling and simulation tools. The lead systems engineer can be empowered to function as the chief designer for the entire development cycle if supported by specialist chief designers who are responsible for the electrical design, the mechanical design, etc.
Implementing ICE with an overall chief designer and supporting specialty chief designers for each IPT allows interleaving IPT design sessions with SEIT design sessions so that the desired iteration between levels of design and the coordination between IPTs necessary to maintain balance in the design can be achieved and the schedule for the development is likely to be  significantly reduced.
The actual times it takes for the planning and for the documentation and analysis periods are highly dependent on the sophistication of the tools used by the design team. If pattern based systems engineering is used and if the team’s modeling and simulation tools are extensive and mature then the planning and the documentation/analysis periods may be possible to be integrated into the design sessions so that the design work becomes a continuous series of three to four hour intense design sessions in the design command center followed by a day or two of planning/documentation/analysis, followed by another design session. Alternatively, the team may be organized with design specialists and documentation specialists. The design specialists conduct analysis, modeling and simulations to determine design parameters. The documentation specialists capture the design parameters and product the necessary specifications, drawings and CDRLs while the design specialists are generating the next layer of design parameters.
12.4 Integrating Modern Methods
The 21st century brought new constraints to system development:
  • Customers and global competition are demanding faster and cheaper system development
  • Skilled engineers are retiring faster than replacements are experienced enough to replace them
  • Development teams are spread across multiple sites and multiple organizations.
This new century has also brought new tools for system development:
  • Fast internet and intranet connections provide real time communication across multiple sites
  • Relatively cheap but powerful computers and network communication tools
  • Model based and Pattern Based Systems Engineering processes
  • Powerful CAD tools
  • Maturing integrated design and design documentation processes
  • Some integrated design and manufacturing tools
  • Potential for end to end documentation management
The question for systems engineers is how to use the new tools to relieve the new constraints.
One answer to this question is to integrate the methods described in this and previous chapters with disciplined execution of the traditional fundamentals of the systems engineering process.
Figure 12-4 illustrates methods that can be synergistically integrated to achieve reductions in design time of factors of three to ten and cost reduction by factors of two to three. These benefits are not achieved instantly. Training is needed for teams to use these methods effectively. Investment is necessary to achieve the best results of PBSE and to push patterns down from the system level to subsystem and assembly levels. Ongoing investment is necessary to maintain the modeling, simulation, software development and CAD/CAM tools required to remain competitive. Document generation and document management tools are likely to require investments and training to effectively reduce engineering effort. Finally it must be recognized that systems engineering is going to continually evolve by inventing new processes and tools and by introducing new methods and tools for executing current processes.
The rapid introduction of new tools and processes in the past two decades have increased the fraction of a systems engineer’s time that must be spent in training and self-study in order to maintain required skills. This is likely to continue. The increases in complexity of new systems are also likely to continue and these complexity increases may require more sophisticated systems engineering processes than available today. Hopefully new methods and tools will be developed that can handle increased system complexity and the increases in productivity from using new methods are enough to make time available for the training and self-study systems engineers will need.


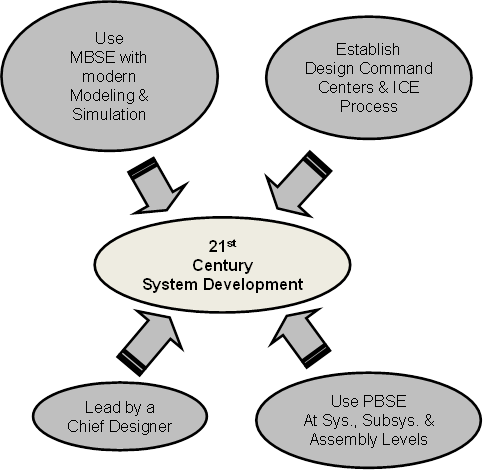
Figure 12-4 The methods described in this book can be integrated to provide a robust approach to system development that can achieve dramatic reductions in cost and design time.

Wednesday, September 14, 2011

11 Introduction to Model Based Systems Engineering


11.0 Introduction
The advantages of using labeled graphical models, diagrams, tables of data and similar non prose descriptions compared to natural language or prose descriptions have been discussed several times. Now we make a distinction between two types of models. One type is, as stated, a non-prose description of something. The second type is analysis models; either static models that predict performance or dynamic models referred to as simulations. Static analysis models may be strictly analytical or may be machine readable and executable. Modern simulations are typically machine readable and executable. This is an arbitrary distinction as the DoD defines a model as a physical, mathematical, or otherwise logical representation of a system, entity, phenomenon, or process. (DoD 5000.59 -M 1998)
In Chapter 5 it was stated that PBSE is model based but includes prose documents as well. The models used in PBSE can be either the first type or the second type. Now we want to introduce a different approach to using models for systems engineering. This approach is called Model Based System Engineering (MBSE) and it strives to accomplish system engineering with models that are machine readable, executable or operative. An INCOSE paper11-1 defines MBSE as an approach to engineering that uses models as an integral part of the technical baseline that includes the requirements, analysis, design, implementation, and verification of a capability, system, and/or product throughout the acquisition life cycle.
This chapter is an introduction to MBSE; no attempt is made to review or even summarize the extensive literature on MBSE. MBSE is rapidly evolving, facilitated both by development of commercial tools and by an INCOSE effort to extend the maturity and capability of MBSE over the decade from 2010 to 2020. Whereas we attempt to describe how MBSE offers benefits compared to traditional prose based systems engineering it isn’t claimed that pure MBSE is superior or inferior to methodologies that mix MBSE, PBSE and traditional methods. The intent is to provide an introduction that enables readers to assess how MBSE can be beneficial to their work and to point the way toward further study.
Traditional systems engineering is a mix of prose based material, typically requirements and plans, and models such as functional diagrams, physical diagrams and mode diagrams. Eventually design documentation ends in drawings, which are models. MBSE can be thought of as replacing the prose documents that define or describe a system, such as requirements documents, with models. We are not concerned as much with plans although plans like test plans are greatly improved by including many diagrams, photos and other models with a minimum of prose.
To some it may seem difficult to replace requirements documents with models. However, QFD can be stand-alone systems engineering process and QFD is a type of MBSE. Although it does not attempt to heavily employ machine readable and executable models, QFD is an example of defining requirements in the form of models. Another way to think about requirements is that mathematically requirements are graphs and can therefore be represented by models. A third way to think about requirements as models is as tree structures. Each requirement may have parent requirements and daughter requirements and just as no leaf of a tree can exist without connection to twigs, twigs to limbs, and limbs to the trunk no requirement can stand alone. Trees can be represented by diagrams so requirements can all be represented in a diagram.
Throughout this book there is an emphasis on representing design information as models in order to reduce ambiguity and the likelihood of misinterpretation of text based design information. There is also an emphasis on using analysis models and simulations as much as possible throughout the life cycle of a system development. The use of models and simulations improves functional analysis, design quality, system testing and system maintenance. Think of MBSE as combining these two principles; then it becomes clear why MBSE is desirable. Another way to look at traditional systems engineering vs. MBSE is for traditional systems engineering engineers write documents and then models are developed from the documents. In MBSE the approach is to model what is to be built from the beginning.
Model based design has been standard practice for many engineering specialties since the 1980s. Structural analysis, thermal analysis, electrical circuit analysis, optical design analysis and aerodynamics are a few examples of the use of Computer Aided Design (CAD) or model based design analysis. It is systems engineering that been slow to transition from non-model based methods, with the exception of performance modeling and simulation. To achieve the benefits of MBSE systems engineers need to embrace requirements diagrams, Use Case analysis and other MBSE tools along with performance modeling and simulation.
11.1 Definitions of Models As Applied to MBSE
Models have been referred to throughout this material without providing a formal definition or defining the types of models typically used in systems engineering. Formally, a model is a representation of something, as described in the DoD definition given above. For our purposes a model is a representation of a design element of a system. Types of models of interest to MBSE include11-2:
Schematic Models: A chart or diagram showing relationships, structure or time sequencing of objects. For MBSE schematic models should have a machine-readable representation. Examples include FFBDs, interface diagrams and network diagrams.
Performance Model: An executable representation that provides outputs of design elements in response to inputs. If the outputs are dynamic then the model is called a simulation.
Design Model: A machine interpretable version of the detailed design of a design element. Design models are usually represented by CAD drawings, VHDL, C, etc.
Physical model: A physical representation that is used to experimentally provide outputs in response to inputs. A breadboard or brass board circuit is an example.
Achieving machine readable and executable models means that the models must be developed using software. Useful languages used by software and systems engineers for such models are the Unified Modeling LanguageTM (UML®) and its derivative SysML™. A brief introduction to these languages is presented here along with references for further study.

Friday, July 15, 2011

Summarize Verification Results in a Compliance Matrix

9.2.5 Compliance Matrix – The data resulting from the actions summarized in the verification matrix for verifying that the system meets all requirements are collected in a compliance matrix. The compliance matrix shows performance for each requirement. It flows performance from the lowest levels of the system hierarchy up to top levels. It identifies the source of the performance data and shows if the design is meeting all requirements. The bottom up flow of performance provides early indication of non-compliant system performance and facilitates defining mitigation plans if problems are identified during verification actions. An example compliance matrix for the switch module is shown in Figure 9-3.


 Figure 9-3 An example Compliance Matrix for the simple switch function illustrated in Figure 9-1.
Note that the requirements half of the compliance matrix is identical to the requirements half of the verification matrix. The compliance matrix is easily generated by adding new columns to the verification matrix. Results that are non-compliant, such as the switching force, or marginally compliant, such as the on resistance, can be flagged by adding color to one of the value, margin or compliant columns or with notes in the comments column.
In summary, the arrows labeled verification in Figure 6-4 from functional analysis to requirements analysis, from design to functional analysis and from design to requirements analysis relate to the iteration that the systems engineers do to ensure the design is complete and accurate and that all “shall” requirements are verified in system integration and system test. This iteration is necessary so that for each requirement a verification method is identified, any necessary test equipment, test software and data analysis software is defined in time to have validated test equipment, test procedures and test data analysis software ready when needed for system integration and test.
9.3 Systems Engineering Support to Integration, Test and Production
Manufacturing personnel and test personnel may have primary responsibility for integration, test and production however; systems engineers must provide support to these tasks. Problem resolution typically involves both design and systems engineers and perhaps other specialty engineers depending on the problem to be solved. Systems engineers are needed whenever circumstances require changes in parts or processes to ensure system performance isn’t compromised.

Tuesday, July 12, 2011

Planning for System Integration and Testing

9.2.2 System Integration and Test Plan – The purpose of the System Integration and Test Plan (SITP) is to define the step by step process for combining components into assemblies, assemblies into subsystems and subsystems into the system. It is also necessary to define at what level software is integrated and the levels for conducting verification of software and hardware. Because of the intimate relationship of the verification matrix to the system integration and test it is recommended that the SITP be developed before the verification matrix is deemed complete.
The SITP defines the buildup of functionality and the best approach is usually to build from the lowest complexity to higher complexity. Thus, the first steps in integration are the lowest levels of functionality; e.g. backplanes, operating systems and electrical interfaces. Then add increasing functionality such as device drivers, functional interfaces, more complex functions and modes. Finally implement system threads such as major processing paths, error detection paths and end-to-end threads. Integration typically happens in two phases: hardware to hardware and software to hardware. This is because software configured item testing often needs operational hardware to be valid. Two general principles to follow are: test functionality and performance at the lowest level possible and, if it can be avoided, do not integrate any hardware or software whose functionality and performance has not been verified. It isn’t always possible to follow these principles, e.g. sometimes software must be integrated with hardware before either can be meaningfully tested.
One objective of the SITP is to define a plan that avoids as much as possible having to disassemble the system to implement fixes to problems identified in testing. A good approach is to integrate risk mitigation into the SIPT. For example, there is often a vast difference between the impact of an electrical design problem and a mechanical or optical design problem. Some electrical design or fabrication problems discovered in I & T of an engineering model can be corrected with temporary fixes (“green wires”) and I & T can be continued with minimal delay. However, a serious mechanical or optical problem found in the late stages of testing, e.g. in a final system level vibration test, can take months to fix due to the time it takes to redesign and fabricate mechanical or optical parts and conduct the necessary regression testing. Sometimes constructing special test fixtures for early verification of the performance of mechanical, electro-mechanical or optical assemblies is good insurance against discovering design problems in the final stages of I & T.
The integration plan can be described with an integration flow chart or with a table listing the integration steps in order. An integration flow chart graphically illustrates the components that make up each assembly, the assemblies that make up each subsystem etc. Preparing the SITP is an activity that benefits from close cooperation among system engineers, software engineers, test engineers and manufacturing engineers. For example, system engineers typically define the top level integration flow for engineering models using guidelines listed above. Manufacturing engineers typically define the detailed integration flow to be used for manufacturing prototypes and production models. If the system engineers use the same type of documentation for defining the flow for the engineering model that manufacturing engineers use then it is likely that the same documentation can be edited and expanded by manufacturing engineers for their purposes.
It should be expected that problems will be identified during system I & T. Therefore processes for reporting and resolving failures should be part of an organizations standard processes and procedures. System I & T schedules should have contingency for resolving problems. Risk mitigation plans should be part of the SITP and be in place for I & T; such as having adequate supplies of spare parts or even spare subsystems for long lead time and high risk items.
System integration is complete when a defined subset of system level functional tests has been informally run and passed, all failure reports are closed out and all system and design baseline databases have been updated. The final products from system integration include the Test Reports, Failure Reports and the following updated documentation:
  • Rebaselined System Definition
    • Requirements documents and ICDs
    • Test Architecture Definition
    • Test Plans
    • Test Procedures
  • Rebaselined Design Documentation
    • Hardware Design Drawings
    • Fabrication Procedures
    • Formal Release of Software including Build Procedures and a Version Description Document
    • System Description Document
    • TPM Metrics
It is good practice to gate integration closeout with a Test Readiness Review (TRR) to review the hardware/software integration results, ensure the system is ready to enter formal engineering or development model verification testing and that all test procedures are complete and in compliance with test plans. On large systems it is beneficial to hold a TRR for each subsystem or line replaceable unit (LRU) before holding the system level TRR.
9.2.3 Test Architecture Definition and Test Plans and Procedures – The SITP defines the tests that are to be conducted to verify performance at appropriate levels of the system hierarchy. Having defined the tests and test flow it is necessary to define the test equipment and the plans and procedures to be used to conduct the tests. Different organizations may have different names for the documentation defining test equipment and plans. Here the document defining the test fixtures, test equipment and test software is called the Test Architecture Definition. The test architecture definition should include the test requirements traceability database and test system and subsystems specifications.
Test Plans define the approach to be taken in each test; i.e. what tests are to be run, the order of the tests, the hardware and software equipment to be used and the data that is to be collected and analyzed. Test Plans should define the entry criteria to start tests, suspension criteria to be used during tests and accept/reject criteria for test results.
Test Procedures are the detailed step by step documentation to be followed in carrying out the tests and documenting the test results defined in the Test Plans. Other terminologies include a System Test Methodology Plan that describes how the system is to be tested and a System Test Plan that describes what is to be tested. Document terminology is not important; what is important is defining and documenting the verification process rigorously.
Designing, developing and validating the test equipment and test procedures for a complex system is nearly as complex as designing and developing the system and warrants a thorough systems engineering effort. Neglecting to put sufficient emphasis or resources on these tasks can result in delays of readiness of the test equipment or procedures and risks serious problems in testing due to inadequate test equipment or processes. Sound systems engineering practices treat test equipment and test procedure development as deserving the same disciplined effort and modern methods as used for the system under development.
The complexity of system test equipment and system testing drives the need for disciplined system engineering methods and is the reason for developing test related documentation in the layers of SITP, Test Architecture Definition, Test Plans and finally Test Procedures. The lower complexity top level layers are reviewed and validated before developing the more complex lower levels. This approach abstracts detail in the top levels making it feasible to conduct reviews and validate accuracy of work without getting lost in the details of the final documentation.
The principle of avoiding having to redo anything that has been done before also applies to developing the Test Architecture Definition, Test Plans and Test Procedures. This means designing the system to be able to be tested using existing test facilities and equipment where this does not compromise meeting system specifications. When existing equipment is inadequate then strive to find commercial off the shelf (COTS) hardware and software for the test equipment. If it is necessary to design new special purpose test equipment then consider whether future system tests are likely to require similar new special purpose designs. If so it may be wise to use pattern base systems engineering for the test equipment as well as the system.
Where possible use test methodologies and test procedures that have been validated through prior use. If changes are necessary developing Test Plans and Procedures by editing documentation from previous system test programs is likely to be faster, less costly and less prone to errors than writing new plans. Sometimes test standards are available from government agencies.
9.2.4 Test Data Analysis – Data collected during systems tests often requires considerable analysis in order to determine if performance is compliant with requirements. The quantity and types of data analysis needed should be identified in the test plans and the actions needed to accomplish this analysis are to be included in the test procedures. Often special software is needed to analyze test data. This software must be developed in parallel with other system software since it must be integrated with test equipment and validated by the time the system completes integration. Also some special test and data analysis software may be needed in subsystem tests during integration. Careful planning and scheduling is necessary to avoid project delays due to data analysis procedures and software not being complete and validated by the time it is needed for system tests.

Friday, July 8, 2011

Methods for Verifying System Performance

9.2 Verifying that System Requirements are Met
The first phase of verifying system requirements is a formal engineering process that starts with requirements analysis and ends when the system is accepted by its customer.  During the system integration and testing steps must be taken to verify that the system satisfies every “shall” statement in the requirements. These shall statement requirements are collected in a document called the Verification Matrix. The results of the integration and testing of these requirements are documented in a Compliance Matrix. The integration and testing is defined and planned in a System Integration and Test Plan. Related documentation includes the Test Architecture Definition, hardware and software Test Plans & Procedures and Test Data Analysis Plans.
The roles of systems engineers in verification include:
  • Developing the optimum test strategy and methodology and incorporating it into the design as it is developed
  • Developing the top level System Integration and Test Plan
  • Developing the hierarchy of Integration and Test Plans from component level to system level
  • Documenting all key system and subsystem level tests
  • Defining system and subsystem level test equipment needed and developing test architecture designs
  • Developing the Test Data Analysis Plans
  • Analyzing test data
  • Ensuring that all shall requirements are verified and documented in the Compliance Matrix.
Good systems engineering practice requires that requirements verification takes place in parallel with requirements definition. The decision to define a requirement with a “shall” or “may” or “should” statement involves deciding if the requirement must be verified and if so how the requirement will be verified. This means that the requirements verification matrix should be developed in parallel with the system requirements documentation and reviewed when the system requirements are reviewed, e.g. at peer reviews and at a formal System Requirements Review (SRR).
9.2.1 Verification Matrix – The verification matrix is documentation that defines for each requirement the verification method, the level and type of unit for which the verification is to be performed and any special conditions for the verification. Modern requirements management tools facilitate developing the verification matrix. If such tools are not used then the verification matrix can be developed using standard spreadsheet tools.
There are standard verification methods used by systems engineers. These methods are:
  1. Analysis -Verifies conformance to required performance by the use of analysis based on verified analytical tools, modeling or simulations that predict the performance of the design with calculated data or data from lower level component or subsystem testing. Used when physical hardware and/or software is not available or not cost effective.
  2. Inspection - Visually verifies form, fit and configuration of the hardware and of software. Often involves measurement tools for measuring dimensions, mass and physical characteristics.
  3. Demonstration - Verifies the required operability of hardware and software without the aid of test devices. If test devices should be required they are selected so as to not contribute to the results of the demonstration.
  4. Test - Verifies conformance to required performance, physical characteristics and design construction features by techniques using test equipment or test devices. Intended to be a detailed quantification of performance.
  5. Similarity - Verifies requirement satisfaction based on certified usage of similar components under identical or harsher operating conditions.
  6. Design – Used when compliance is obvious from the design, e.g. “The system shall have two modes, standby and operation”.
  7. Simulation – Compliance applies to a finished data product after calibration or processing with system algorithms. May be only way to demonstrate compliance.
The DoD SEF defines only the first four of the methods listed above. Many experienced systems engineers find these four too restrictive and also use the other three methods listed. To illustrate a verification matrix with an example consider the function Switch Power. This function might be decomposed as shown in Figure 9-1.

Figure 9-1 A function Switch Power might be decomposed into four sub functions.
An example verification matrix for the functions shown in Figure 9-1 is shown in Figure 9-2. In this example the switch power function is assumed to be implemented in a switch module and that both an engineering model and a manufacturing prototype are constructed and tested. In this example no verification of the switch module itself is specified for production models. Verification of the module performance for production modules is assumed to be included in other system level tests.
It’s not important whether the verification matrix is generated automatically from requirements management software or by copy and paste from a requirements spreadsheet. What is important is to not to have to reenter requirements from the requirements document to the verification matrix as this opens the door for simple typing mistakes.

Figure 9-2 An example verification matrix for a switch module.

Wednesday, July 6, 2011

Verifying the Performance of a System Design

9 Processes and Tools for Verifying Technical Performance
9.0 Introduction
There are two approaches to verifying technical performance. One is using good engineering practices in all the systems engineering and design work to ensure that the defined requirements and the design meets customer expectations. The other is a formal verification process applied in two phases to hardware and software resulting from the design to verify that requirements are met. Both begin during requirements analysis and continue until a system is operational. The work is represented by the three arrows labeled verification in Figure 6-4 that constitute the backward part of the requirements loop, the design loop and the loop from design synthesis back to requirements analysis and includes both verifying completeness and accuracy of the design and verifying the technical performance of the system.
The first phase of formal system verification typically ends with delivery of a system to the customer but may include integration and testing with a higher level system of the customer or another supplier. The second phase of system verification is accomplished by testing the system in its intended environment and used by its intended users. This phase is typically called operational test and evaluation and is the responsibility of the customer for military systems but may involve the supplier for commercial systems and some NASA systems.
9.1 Verifying Design Completeness and Accuracy
Verifying the completeness and accuracy of the design is achieved by a collection of methods and practices rather than a single formal process. The methods and practices used by systems engineers include:
  • System engineers checking their own work
  • Checking small increments of work via peer reviews
  • Conducting formal design reviews
  • Using diagrams, graphs, tables and other models in place of text where feasible and augmenting necessary text with graphics to reduce ambiguity
  • Using patterns vetted by senior systems engineers to help ensure completeness and accuracy of design documentation
  • Developing and comparing the same design data in multiple formats, e.g. diagrams and matrices or diagrams and tables
  • Verifying functional architecture by developing a full set of function and mode mapping matrices including:
    • Customer defined functions to functions derived by development team (Some team derived functions are explicit in customer documentation and some are implicit.)
    • Functions to functions for defining internal and external interfaces among functions
    • Sub modes to functions for each of the system modes
    • Mode and sub mode transition matrices defining allowable transitions between modes and between sub modes
  • Using tools such as requirements management tools that facilitate verifying completeness and traceability of each requirement
  • Using QFD and Kano diagrams to ensure completeness of requirements and identify relationships among requirements
  • Using robust design techniques such as Taguchi Design of Experiments
  • Iterating between requirements analysis and functional analysis and between design synthesis and functional analysis
  • Employing models and simulations to both define requirements and verify that design approaches satisfy performance requirements
  • Validating all models and simulations used in systems design before use (Note the DoD SEF describes verification, validation and accreditation of models and simulations. Here only verification and validation are discussed.)
  • Employing sound guidelines in evaluating the maturity of technologies selected for system designs
  • Maintaining a through risk management process throughout the development program
  • Conducting failure modes and effects analysis (FMEA) and worse case analysis (WCA).
Engineers checking their own work are the first line of defense against human errors that can affect system design performance. One of the most important things that experienced engineers can teach young engineers is the importance of checking all work and the collection of methods for verifying their work that they have learned over their years in the engineering profession. Engineers are almost always working under time pressure and it takes disciple to take the time to check work at each step so that simple human mistakes don’t result in having to redo large portions of work. This is the same principle that is behind using peer reviews to catch mistakes early so that little rework is required rather than rely on catching mistakes at major design reviews where correcting mistakes often requires significant rework, with significant impact on schedule and budget.
A reason for presenting duplicate methods and tools for the same task in Chapter 6 was not just that different people prefer different methods but also to provide a means of checking the completeness and accuracy of work. The time it takes to develop and document a systems engineering product is a usually a small fraction of the program schedule so that taking time to generate a second version in a different format does not significantly impact schedule and is good insurance against incomplete or inaccurate work.
Pattern based systems engineering, QFD and Taguchi Design of Experiments (DOE) help ensure the completeness, accuracy and robustness of designs. Extensive experience has demonstrated the cost effectiveness of using these methods even though QFD and Taguchi DOE require users to have specialized training to be effective.
Studies have shown that selecting immature technologies result in large increases in costs (See http://www.dau.mil/conferences/presentations/2006_PEO_SYSCOM/tue/A2-Tues-Stuckey.pdf) Immature technologies often do not demonstrate expected performance in early use and can lead to shortfalls in the technical performance of designs. As a result both NASA and DoD include guidelines for selecting technologies in their acquisition regulations. Definitions of technology readiness levels used by NASA are widely used and are listed at http://esto.nasa.gov/files/TRL_definitions.pdf . Definitions are also provided in Supplement 2-A of the DoD SEF.
Failure analysis methods like FEMA and WCA are more often used by design engineers than systems engineers but systems engineers can include failure modes and worse case considerations when defining the criteria used in system design trade studies.
In summary, verifying technical performance during system development includes the disciplined use of good engineering practices as well as the formal performance verification process. This should not be surprising as these practices have evolved through experience specifically to ensure that system designs meet expected performance as well as other requirements.

Thursday, June 30, 2011

Who Leads System Design?

8.5 Design Oversight Responsibility
Although it is not the intent of this book to describe systems engineering management processes it is helpful to briefly describe how roles and responsibilities change during the system development phases. The first change in responsibility takes place when the baseline design is refined through trade studies to be the preferred design, e.g. a best value design, and the design requirements database is complete. The system development work is then at the end of the define requirements phase and ready to enter the design phase. This means the design requirements are complete to the level of responsibility of each of the lowest level IPTs, assuming the work is organized so that the lowest level IPT leaders are able to work in the “craftsman” model, i.e. the leader has the knowledge and experience to make all the design decisions for the work assigned to his/her IPT. At this point the individual IPTs take leadership responsibility from the SEIT or systems engineering and lead in determining how the system is designed and any prototypes built.
During the design phase systems engineering watches over the design to ensure requirements compliance, testability and producibility and monitors MOEs, progress on “ilities” and risk management. In addition, systems engineering is responsibility to manage any specification changes. If designers encounter difficulties in meeting an allocated requirement then systems engineers should take responsibility for determining if and how the requirement in question can be modified without jeopardizing overall requirements compliance. The systems engineering role during the design phase can be summarized as supporting the designers to ensure that a balanced and compliant design is achieved that is testable, producible and maintainable.
The transition from the system definition phase to the design phase is typically gated with a design review, e.g. a System Design Review (SDR). Program managers often wish to move systems engineers off a development project when the actions items from a SDR are complete. Although this is a time to increase the design specialty engineers and decrease the systems engineers on the IPTs removing too many systems engineers can leave the designers without adequate systems engineering support and cause other necessary tasks to be understaffed. It is better to assign the systems engineers to tasks like preparing system and subsystem integration and test plans and completing and maintaining the system design documentation.
When the design phase is compete and any prototypes are fabricated then systems resumes lead responsibility during test even though other specialty engineers may conduct the testing. Typically this change in leadership occurs sometime during integration and subsystem testing of an engineering model or prototype. These leadership responsibility transitions should occur naturally for IPTs with experienced systems and design engineers.

Tuesday, June 28, 2011

Some Useful Design Concept Diagrams

8.4 Diagrams Useful in Selecting the Preferred Design
As discussed previously much of systems engineering is determining relationships between a system and its environment and among the various subsystems. Ultimately these relationships are defined in detailed drawings but understanding the relationships in order to select the preferred design is aided by examining a system with different levels of abstraction. The modern tools used for electrical and optical design and the design practices of electrical and optical design engineers develop their respective design concepts with diagrams. The diagrams start with block diagrams with a high level of abstraction, perhaps just naming the subsystems, and proceed to greater and greater detail. This process makes it easy for systems engineers and other design engineers to readily understand the electrical and optical design concepts.
Although there are excellent modern design tools for mechanical and thermal design it isn’t as easy to present the mechanical and thermal designs with ever decreasing levels of abstraction so that system engineers and other design engineers can easily understand the mechanical and thermal designs. Experienced mechanical and thermal design engineers develop the desired diagrams and tailor their diagrams to the system being developed so that others can readily understand and assess their designs. A few examples are presented here to illustrate how experienced mechanical and thermal designers examine and communicate their design concepts. Note how easy it is to think of alternative design approaches when design concepts are presented in simple block diagram form with a high degree of abstraction. This enables engineers other than expert mechanical and thermal designers to assess design concepts and suggest design alternatives.
8.4.1 Simple Mechanical and Thermal Block Diagrams - Many times a simple block diagram is useful in describing a mechanical or a combined mechanical/thermal design concept. Figure 8-7 is an example showing a system that consists of five assemblies, a frame for mounting the assemblies and a mounting plate that supports the system with a three point mount.

Figure 8-7 A simple mechanical block diagram of a system illustrates how the assemblies interact with each other and the mounting frame.
It’s easy to see that the design concept is for each assembly to be coupled to the mounting frame and uncoupled from any other assembly. Four of the assemblies are temperature controlled whereas the fifth assembly is attached to the mounting frame but not within the temperature controlled region. By abstracting all of the size, shape, material and other characteristics of the system the basic mechanical and thermal relationships are easily understood and alternative concepts are obvious. The actual models that the mechanical designer uses to conduct trade studies of alternate mounting concepts are of course much more detailed and usually include the detailed characteristics of the various assemblies, frame and mounting plate; however, this detail is not necessary to explain the concepts and results of the trades to the system engineers and other designers.
Let’s suppose that three of the assemblies of the system shown in Figure 8-7 have critical alignment requirements. A perfectly good way to record and communicate the alignment requirements is with allocation trees. However, sometimes it makes the requirements clearer and possibly less prone to misunderstandings if a simple diagram is used in place of a tree. Such a diagram with the alignment requirements for each of the three assemblies and for the attachment points of each on the system mounting frame might look like Figure 8-8.

Figure 8-8 A simple block diagram illustrating the alignment requirements for three of assemblies and their respective interfaces with the mounting frame.
Similar simple block diagrams can be used to illustrate temperatures and heat flow paths. It sometimes makes design concepts easier to understand if mechanical and thermal diagrams are developed together. Examples are shown in Figures 8-9 and 8-10 that illustrate simple block diagrams of structural interfaces and thermal interfaces on similar block diagrams.

Figure 8-9 A block diagram illustrating structural interfaces within a system and between the system and its parent platform.

Figure 8-10 A block diagram illustrating thermal interfaces within a system and between the system and its environment using the same diagram approach as used for the structural interface diagram.
Even though it takes some time and care to develop diagrams such as shown in the examples above the benefits to the team in understanding and refining design concepts to reach the preferred design are well worth the effort. Diagrams like these and related simple diagrams for electrical, optical and other design concepts are invaluable in explaining a design concept to customers and management.

Thursday, June 23, 2011

Modeling and Simulation Supports Entire Development Cycle

8.3 Modeling and Simulation
Modeling and simulation tools are used in all phases of system development from definition to end-of-life. Systems engineers are concerned with the models and simulations used in system definition, design selection and optimization, and performance verification. Systems engineers should identify the models and simulations needed for these tasks during the program planning phase so that any development of required models and simulations can be complete by the time they are needed. Examining the customer’s system requirements and the planned trade studies help identify the needed models and simulations. Parameter diagrams are often helpful in identifying the models and simulations needed.
Models constrained by requirements are typically adequate to be used in the system definition phase to define a baseline design concept. Models may be adequate to develop error budgets and allocations but performance simulations are often necessary to select and optimize designs.
System simulations and particularly performance simulations are especially useful in system performance verifications. Therefore it is necessary to include any necessary validation of system simulations in test plans and procedures. End-to-end system simulations are sometimes needed to verify final design compliance with requirements. Other uses include developing the requirements for data analysis tools needed during subsystem and system verification testing, reducing risk and time for developing test software and supporting troubleshooting during test and operational support.
Examples of how models and simulations might be used in system development are shown in Figure 8-4. In this figure the system under development is assumed to be a system that measures parameters by sampling the parameters that are related to a desired phenomenon that cannot be easily or economically measured directly. The measured samples are assumed to be processed first by Data Algorithms, which in this example produce calibrated data. The calibrated data are

Figure 8-4 Examples of ways models and simulations might be used in developing a sensor or measurement system.
then input to Product Algorithms which use the calibrated data to produce estimates of the desired phenomena.
It is assumed that a database of truth data is available. This truth data is used in two ways. It is used to predict the parameters that the system is designed to sample by using a model; called a Parameter Model in Figure 8-4. These predicted parameters are then the input to the System Model and System Simulation. The truth data is also used to assess the validity of the system model and the system simulation by comparing the results predicted by the Product Algorithms with the truth data. This example assumes that the System Model generates calibrated data and the System Simulation generates data that must be processed by the Data Algorithms to provide calibrated data. If truth data is available for the desired phenomenon during system operation then the truth data can be used to assess the performance of the system during operation as suggested by the figure.
It is assumed that Environmental Models are developed that can also generate the parameters to be measured. Information from the System Specification is used to generate the parameters in the desired range and with the desired statistics. If the database of truth measurements is representative of the specified range and statistics of the phenomena to be measured then the Parameter Model can be used to generate inputs for system design analysis and as comparisons for system test data analysis and comparisons. If no database of truth measurements is available then Environmental Models are used in place of the Parameter Model but it is not possible to assess results against truth data.
8.3.1 Performance Modeling and Simulation - System performance models and system performance simulations are used in trade studies to evaluate alternative designs and to iteratively optimize the selected design. Typically the system design objective is to develop the “best value” design solution. A “best value” design can be defined as:
·         Achieves performance above minimum thresholds
·         Has life cycle costs within customer’s or marketing’s defined cost limits
·         Meets requirements allocations (mass, power, etc.)
·         Assessed to be relatively low risk (so that cost targets are likely attainable)
A general approach to achieving a best value system design is to develop multiple design concepts, assess the cost and performance of each and iterate until the best value is achieved. This usually involves progressively lower level trade studies.
 Assessing the cost and performance of system design concepts requires analysis and state-of-the-art tools. Design tools for mechanical, thermal, electrical and optical analysis are well developed, widely available and indispensible for design of modern systems. The same cannot be said for the cost models and top level performance modeling and simulation tools for systems analysis. System performance modeling and simulation tools are too specialized for widespread utility. Thus most systems organizations must develop the modeling and simulation tools needed for defining their systems. Useful cost models are available for some systems for organizations developing systems for government agencies like the Defense Department and NASA. Examples of cost estimating models useful for several types of systems and cost estimating tasks include SEER (http://www.galorath.com/) and PRICE (http://www.pricesystems.com/).
The first two steps in seeking a best value design are shown in Figure 8-5. The cost model is used to identify a number of design parameters that drive the system cost and quantify how the cost, or the relative cost, depends on each design parameter. The system performance modeling and simulation tools are used to quantify the dependence of system performance on each of the same design parameters.

Figure 8-5 Cost models and system performance models and simulations are used to determine the relationship of cost and performance on design parameters.
Having the relationships of cost and performance on design parameters these data can be combined to reveal how the selected design parameters drive the relationship of performance to relative life cycle as shown in Figure 8-6. Assuming the cost and performance relationships are determined for n design parameters then the result is n trades of cost vs. performance as a function of each of the n design parameters. It is usually straightforward to select the value of each design parameter that offers the best value design according to the desired criteria. For example, in Figure 8-6 the best value for the design parameter shown is 8 cm because it’s near the maximum of the linear portion of the parametric curve and it offers the best performance within the constraints on this particular design parameter.


Figure 8-6 The best value design is determined by combining the data from the cost model and performance models and simulations that determine how design parameters drive cost and performance.

Tuesday, June 21, 2011

Design Trade Matrices and Other Trade Study Methods

8.2.2 Design Trade Matrices - The Pugh Concept Selection process can be repeated until no new concepts are suggested that are better than the existing set. When a final set is agreed upon the next step is to conduct a weighted trade using a design trade matrix (decision matrix in NASA nomenclature). A design trade matrix might look like Figure 8-3 for three candidate concepts.


 Figure 8-3 An example design trade matrix for three concepts and three weighted criteria.

Again if QFD is used the weights for the criteria can be drawn from the QFD analysis. If not then engineering judgment can be used for the weights. In the example shown the weights are selected over a range from 1 to 5. An alternative is to use percentages that add to 100 percent for all criteria. Attribute scores can be 1, 2 or 3 or 1, 3 or 9 or the actual results of using an analytical tool. If different tools are used for different criteria the attribute scores can be normalized to a fixed range for all criteria to maintain the validity of the selected weights.
The step following determining the total scores is to perform a sensitivity check so ensure the results are significant. One method of performing a sensitivity check is to examine evaluation values for criteria with large weights. If a small change in one evaluation changes the total score to favor a different concept that the results aren’t reliable. If the results are not reliable then consider adjusting the weights, adding additional criteria or using a more sensitive method of determining attribute scores.
8.2.3 Pitfalls for Trade Studies – Common mistakes that can lead to ineffective trade study results include:
  1.       Poor requirements definition can result in a trade result that may not be good for properly defined requirements.
  2.     Valuable alternatives may be missing if alternatives are defined without brainstorming by several experienced people with a diversity of skills and experience.
  3.     Allowing biased weightings or selection criteria often results in selecting alternatives that are driven by the biases and not the optimum alternative that would be selected with unbiased trades.
  4.       The fatal error is having no winner. This results if the spread of the weighted score is less than the spread of estimates of errors. The sensitivity analysis step in Figure 7.1 is crucial to effective trades.
  5.       Inappropriate models used for determining attribute scores. Models not only have to be relevant to the trade being performed they must have credibility in the eyes of the decision makers, they should lead to scores for the different alternatives that are spread more than the estimates of errors in the model results, the algorithms and internal mathematics must be transparent to the users and they must be sufficiently user friendly that the analysis can be conducted with confidence and in a timely manner.
  6.       Conducting system and design related trade studies outside the control of systems and design engineering. Development program managers sometimes pull systems and design engineers off programs early to save money and then allow procurement, operations or product assurance personnel to conduct trades without the oversight of the appropriate systems or design engineers. This can lead to a multitude of difficulties and usually expensive difficulties. Suffice it to say that systems engineers and design engineers must retain control of systems and design trades throughout the life cycle.

8.2.4 Other Design Trade and Decision Methodologies - The design trade process defined in Figure 8-1 is a proven methodology but not the only useful tool or methodology available. The NASA Systems Engineering handbook describes several techniques useful for trade studies and more general decision making. These include:
·         Cost benefit analysis
·         Influence diagrams/decision trees – the NASA handbook and Wikipedia have poor descriptions of these tools. A more useful description can be found at http://www.agsm.edu.au/bobm/teaching/SGTM/id.pdf and for a more thorough and mathematical description see http://www.stanford.edu/dept/MSandE/cgi-bin/people/faculty/shachter/pdfs/TeamDA.pdf These tools have available software to facilitate developing the diagrams and converting influence diagrams to decision trees.
·         Multi-criteria decision analysis (MCDA) - useful for cases where subjective opinions are to be taken into account. Start with: http://en.wikipedia.org/wiki/Multi-criteria_decision_analysis See also http://www.epa.gov/cyano_habs_symposium/monograph/Ch35_AppA.pdf
o   Analytic hierarchy process (AHP) – a particular type of MCDA that employs pairwise comparison of alternatives by experts.
·         Utility Analysis (The DoD SE handbook calls this Utility Curve Analysis)
o   Multi-Attribute Utility Theory (MAUT) (A MCDA technique for Utility Analysis)
·         Risk-Informed Decision Analysis- for very complex or risky decisions that need to incorporate risk management into the decision process.