Search This Blog

Wednesday, June 26, 2013

28A Example Process Improvement Methods

It is the intent of this course to teach the student the value of learning and applying methods of statistical process control for process improvement and encourage the student either to learn these methods via self-study or from a training course. Although it is not the intent to teach these methods in this course giving examples may help the student understand the value of learning and applying them. Therefore this lecture provides simple examples of process improvement methods and tools to enable the student to get a feel for what is involved in process improvement and begin using these methods on simple processes. The lecture is a bit long and requires careful reading because there are a number of important concepts involved and simpler examples would not adequately present these concepts. Read this lecture when you are fresh and can devote time for a tedious but important read.
The example presented here is a college library’s book search and checkout process. Let’s assume that the librarians are receiving complaints that it takes too long to find and check out books. Process improvement shouldn’t have to wait until customers make complaints but complaints can help direct the improvement process. When the librarians first decided that they were getting so many complaints that they should try to fix the problems the head librarian wasn’t convinced that the complaints reflected any real problems. She felt that there might be just a few disgruntled students complaining. Therefore they decided to collect some data over the next week. They used a check sheet to collect the data. Check sheets are used to collect numerical data over a period of time. A check is made on a form or any sheet of paper each time an event of interest is observed. The check sheet resulting from the librarians monitoring of the fraction of library users complaining about any of the library's processes is shown in figure 20.


Figure 20 Check sheet recording the complaints about library service for one week.
Seeing that complaints were being received from an average of 17% of the library’s users the head librarian authorized the librarians to form a process improvement team to try to improve the library’s processes so that complaints would be reduced.
Flowcharting to define the process
The first step for the process improvement team is to conduct a brainstorming meeting to discuss the complaints and plan how to react to the complaints. To help guide the brainstorming meeting the team prepared a flow chart of the library’s process for finding and checking out books. The team’s flow chart is shown in figure 21.


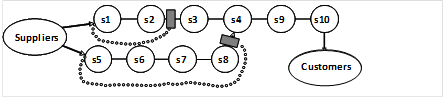
Figure 21 The process improvement team’s flow chart for the process of finding and checking a book out of a library.
A flow chart diagrammatically lists each step in a process in a time ordered sequence. Flow charts establish ownership of process steps, establish boundaries, define key interfaces and define the overall process and thereby ensure that the team has a common understanding of the process in question. Flow charts are most helpful for complex processes where there a lot of decision points, inspection points and loop backs. The charts help clarify what is really happening in a process vs. what might have been planned and the charts are an excellent tool for helping a process improvement team focus its discussion and brainstorming sessions.
There are useful variations on flow charts including listing items under columns labeled Supplier, Input, Process, Output and Customer in the sequence of the processes forming an overall process. Examining a process several times using different format charts often reveals new insights into the process. Perhaps you can think of even more ways to define the flow of processes in your organization.
Analyzing the process
The team discussed each step in the flow chart to get ideas for what might be the source of the students' complaints. At a brainstorming meeting each attendee is allowed to offer any ideas for the cause of the problems and any ideas for developing solutions. All ideas are recorded first, and then they are discussed to select those that are most promising. Constructing a cause and effect diagram, often called a fishbone diagram, is a good tool for collecting and discussing ideas for the causes of the complaints. A final fishbone diagram for the library’s slow process might look like that shown in figure 22. It helps guide the brainstorming if the possible causes of problem are grouped in four categories. Use the four P’s of Procedures (including Processes), People, Policies and Plant (i.e. buildings and equipment) for four categories of problems in service organizations. Similarly, the four M’s of Material, Methods, Machines, and Man are helpful categories of problems in manufacturing or project organizations that deal with things rather than services. Over time your organization may find other categories that are more useful for your specific organization. A category that is often added is Environment.


Figure 22  Fishbone diagram of potential causes for slow library process.
The next step is to gather data to determine which of the potential causes are the biggest contributors to the students’ complaints. Two approaches are to gather data from the students that are complaining and to gather data on the process itself. Data can be gathered from the students by querying them during checkout and/or by asking them to participate in a survey. Let’s assume the librarians decide to use a survey. They design the survey based on the data in the fishbone diagram. The result is the following list of questions:
1. Do you think finding and checking out a book is?
Fast ____
Ok _____
Too slow ____
 2. Do you think the process is?
Easy ____
Too complex ____
If too complex, what part of the process do you find the most complex?__________________________________________
1.     Are the library’s instructions helpful?___ , Little help?____, No help?_____
2.     Are the librarians helpful?____, Little help?_____, No help_____?
3.     Which step takes you the most time?
a.      Finding desired books in the catalog______
b.     Finding books in the stacks_______
c.      Checking out the books you have found_______
4.     What changes would improve the process for you? __________________________________________________________________________________________________
5.     When you need help from a librarian is there usually one available?  Yes__,No__
6.     Is the library open when you need to get books? Yes____, No_____
Let’s assume that 100 surveys are collected and analyzed. The finding might look like the following: (Note numbers won’t add up as some students won’t answer all questions.)
1. Do you think finding and checking out a book is?
Fast __5
Ok __10
Too slow __85
 2. Do you think the process is?
Easy ____12
Too complex ____84
If too complex, what part of the process do you find the most complex? 65 said the having to give too much data to the librarians; 10 said finding books in the catalog and 4 said finding books in the stacks.
3. Are the library’s instructions helpful? __11, Little help? _73, No help? _8
4. Are the librarians helpful?__92, Little help?___6, No help___1?
5. Which step takes you the most time?
a. Finding desired books in the catalog___25
b. Finding books in the stacks_____40
c. Checking out the books you have found___32
6.What changes would improve the process for you?___74 said having to provide just student name or name and ID number to the checkout librarian, 10 said adding more catalog computers, 5 gave miscellaneous answers and 6 gave no answers.
 7. When you need help from a librarian is there usually one available? Yes_87, No_10
 8. Is the library open when you need to get books? Yes__86, No___12
It is clear from the results of the survey that the biggest source of complaints is having to give the student’s name, local address and home address each time a book is checked out, as required by the library’s policy and the checkout software. The students recommend having to provide only their name or their name and student ID number. The library is open when most students need it open and the librarians are available and helpful for most students. Similarly, finding books in the catalog and in the stacks take time but are not problems for most students.
The survey provides useful information but the librarians must analyze the process, implement candidate improvements and check the effectiveness of the candidate improvements. Analyzing the process means establishing measurement points, collecting data and checking the collected data to see if the actual time data correlates with the students’ complaints.
During the time the surveys were being collected an assistant librarian timed students as they performed the different tasks involved. These times were collected for 85 students. The total times were analyzed in 15 samples of 5 students each and the average total times of each sample of 5 were plotted in a control chart called an “X bar- R” chart. (There are mathematical reasons for working with averages of subgroups, which you will learn in your more comprehensive studies of statistical methods.) X-bar stands for the average of each sample group and R stands for the range in value of the sample. The resulting chart is shown in figure 23.


Figure 23 X bar-R chart for total process times for 15 sample groups of 5 students each.
The upper control limit is calculated from the equation UCL= X bar + 0.577R bar and the lower control limit from LCL= X bar- 0.577R bar. (The parameter 0.577 is specific to sample averages of 5 items per sample group and would be different if more or less than 5 items are in the sample group. Books on statistical process control, like the Memory Jogger, list the equations and parameters needed to develop control charts.)
The control chart in figure 23 tells the librarians that the overall process is stable, i.e. it exhibits only common cause variation. Therefore they can make changes to the process and be assured that changes in the average times are due to their changes and not something else going wrong. Had there been points above the UCL and/or below the LCL the process would have special cause variation and the effect of any changes couldn’t be reliably attributed to the change.
Knowing they have a stable overall process the process improvement team examined the average times of the various steps in the overall process. The results are shown in table provided in figure 24. Note that before making any changes to any step in the process it is necessary to examine the control chart for that step to ensure the step is stable as well as the overall process. For this example we assume each step is stable.


Figure 24 Table of average times for each step in finding and checking out a book
The timed process data provides further insight into the students’ complaints. They complain that the process is too slow and complex and they identify having to provide too much data to the checkout librarian as their biggest contributor to their complaints. The data suggests that having to supply the personal data is irritating rather than taking too much time. The largest contributor to the total average time is the time spent in the stacks and the students did not complain about this time.
Exercise
A Pareto chart is a bar graph with the data ordered from left to right so that the largest is on the left, the second largest next, etc. This chart helps a process improvement team focus on the problem to solve first. Using the data table in figure 24 prepare a Pareto chart of the data. Your result should look like figure 25.


Figure 25 A Pareto chart for the times of each step in the overall process.
If you find that the pace of blog posts isn’t compatible with the pace you  would like to maintain in studying this material you can buy the book “The Manager’s Guide for Effective Leadership” in hard copy or for Kindle at:
or hard copy or for nook at:
or hard copy or E-book at:


Tuesday, June 18, 2013

27 B The Productivity Experiment

There is another experiment that I developed that helps managers in charge of processes for which a high throughput is important to the effectiveness of the organization.  This experiment is a game that teaches the impacts of variation and work in process on effectiveness and profitability.
The game is for two teams each with an equal number of players and a team leader. It is adaptable to two to about 20 trainees, it can be generic or specific to a process and there can be multiple levels of sophistication, although only one level is described here. This level treats variation and work in process inventory but ignores inventories of raw materials and finished goods and ignores the effects of lot size. Students can modify the game to include these effects if the effects are important to training in their organization. This description assumes ten or fewer trainees with two as team leaders and the others as workers. Workers role dice and move items representing work from process to process. Leaders verify workers results, record data, calculate throughput and work in process inventory. If there are more than ten trainees they are given assignments as production control, inspectors, supervisors or finance workers and take over the leader’s roles in the game appropriate to these titles.
 One leader gets to choose between two processes with the same average throughput. One process has high capacity, but relatively high variation, and the other process has lower capacity but also lower variation. The other gets the left over process. The game is played by rolling dice that determine the throughput of each step in a process that has a step for each worker on a team. The game is played in cycles with a cycle being one turn at rolling the die for each worker on the team. Three cycles are usually sufficient to demonstrate the principles.
The high capacity team gets a die with numbers 1 to 6 so that its average throughput is 3.5 but the variation can be from 1 to 6. If the game is played for three cycles this team’s overall process has a capacity equal to the number of cycles times the largest die number, or 18. Capacity is defined as the maximum possible through put if each worker rolls the largest number on each turn.
The low capacity team gets a die with only the numbers 3 and 4 so that its average through put is also 3.5 but the variation is only from 3 to 4. (Equivalently, use a regular die but rolling 1, 2, or 3 is counted as a 3 and rolling a 4, 5, or 6 is counted as a 4.) The capacity of this team’s overall process for three cycles is 12 compared to 18 for the high capacity team’s overall process. Each team starts with a pile of chips that represent items of work. The objective is to move as many items from the first step through the entire process for delivery at the end and to have as few chips as possible left stranded as work in process (WIP) inventory.
Each team gets the same amount of input items for its process and gets “paid” according to its total production, i.e. sum over the number of cycles of the number of output items at the end of each cycle. However, each team is charged with the cost of WIP inventory, i.e. the sum over the cycles of the number of items that are still in the intermediate steps of its process when each cycle is over.
When a player rolls a die a number of items equal to the die result are moved through that player’s step in the process. E.g. if the first player rolls a three then three items are moved through the first step to the second step. If the second player rolls a two then two items are moved to the third step but if the second player rolls a four only three items are available to be moved. After each team has completed the same number of cycles the game is stopped and the financial results are calculated.
I have found that the typical manager that is oriented toward high productivity chooses the high capacity process in spite of its higher variation and is then amazed when his team gets soundly beaten because of both low production and all the work in process the high variation produces. It is easy to see how this happens. The production is equal to the number of cycles times the throughput of the last worker in the process. The low capacity team has a throughput of at least three per cycle whereas the high capacity can easily be limited to a throughput of only one or two if any of the workers rolls a one or two during a cycle. Thus the lower variation of the lower capacity team overcomes the lower capacity and usually results in higher total production. The lower capacity team’s lower variation results in WIP for each cycle being one, if the first worker rolls a four or zero if the first worker rolls a three. The higher capacity team can have WIP for each cycle of as much as five if the first worker rolls a six and any subsequent player rolls a one.
This game is a good introduction to teaching process improvement, just in time inventory and theory of constraints to managers responsible for processes in which throughput is important. Although the game was designed for a manufacturing process it doesn’t matter whether the items moving from step to step are manufactured items or paper products in a service organization. In both organizations processes with high variation result in both reduced throughput (efficiency) and excess work in progress. Therefore reducing variation has a high payoff even without changing the mean throughput capability of any step in the process, including the constraining step. This is not obvious to many workers or managers until they experience the results of the game described above.
Exercise 3
Try the productivity experiment yourself. You can play the roles of each of the workers on each of the teams. For example use a spreadsheet with a column for each worker plus a column for throughput per cycle and a column for WIP inventory per cycle. Each cycle is assigned three rows, one for the result of rolling the die, one for the throughput and one for the WIP inventory. Try four workers per team and carryout three cycles as described. You will find that the process with a capacity of 12 and variation of 3 or 4 typically achieves production of 9 and WIP of 3 or less for three cycles. The process with capacity of 18 and variation of 1 to 6 typically achieves production of less than 9 and WIP of 6 to 8 for three cycles.


If you find that the pace of blog posts isn’t compatible with the pace you  would like to maintain in studying this material you can buy the book “The Manager’s Guide for Effective Leadership” in hard copy or for Kindle at:
or hard copy or for nook at:
or hard copy or E-book at:


Tuesday, June 11, 2013

27A Managing in the Presence of Variation

I cannot overemphasize the importance of learning how to understand variation and how to manage in its presence. Brian Joiner said it best in his training course (Copyright Oriel Incorporated, formerly Joiner Associates, 2009). “When people don’t understand variation:
        They see trends where there are no trends and miss trends where there are trends
        They blame, or credit, others for things over which the others have no control
        They can’t understand the past or plan for the future properly
        Their ability to manage or lead is impaired”
Managers can learn to manage in the presence of variation if they do three things:
        Learn appropriate statistical methods; as described in the Memory Jogger or similar book
        Ensure workers are trained in & use appropriate problem solving and statistical methods
        Learn to think statistically
This lecture addresses learning statistical methods, learning to think statistically and discusses three experiments that are valuable to learning about managing in the presence of variation
Learning Statistical Methods
To achieve the increased organizational effectiveness promised by this course it is necessary to train everyone in the organization in the basic problem solving tools and statistical methods covered in the Memory Jogger. Workers and managers must become familiar with and use flow charts of their processes, check sheets to gather data on their processes, Pareto charts, cause and effect diagrams (fishbone diagrams), run charts, histograms, scatter diagrams and control charts.
Self-study of the Memory Jogger book or a similar book that is written for self-study is one way of learning appropriate statistical methods. In my experience the best way to learn these techniques is to train teams that have common ownership of processes. The team picks a problem in one of the team member’s processes that they think needs improving. A trainer, well versed in these methods then teaches several teams at a time by teaching a technique and then letting the teams put the technique into practice for the problem they have selected. It takes about 50 hours spread over about three months for a team to work through learning the techniques, gathering data, analyzing the data and evaluating the success of its process improvement efforts.
It typically costs several thousand dollars per team, in addition to the cost of the team’s time, for such training. However, the cost savings resulting from the process improvements conducted as part of the training typically saves five to ten times the cost of the training within about a year. This claim is based on documented savings of over $20 million by about 300 such team training efforts over several years in the late 1980s. These teams were from several types of organizations including manufacturing, health care, and civil government services.
Using Statistical Methods
After teams are trained they are ready to be empowered to have control over their process within some boundaries that must be determined for each organization. Typically trained and empowered teams do not have to be encouraged to take control of their processes. Most are eager to fix problems that bother them by making their work more difficult or increasing their work load. These are also the problems that reduce the effectiveness of the team’s processes. As mentioned earlier, it is important to monitor empowered process improvement teams so that workers are not too heavily involved in process improvement at the expense of getting normal work done. In organizations of more than about 40 people it is prudent to designate a person skilled in statistical process control techniques to monitor all process improvement work. This person should ensure that workers are collecting data on the workers’ processes, preparing control charts and solving special cause variation to bring their processes into stable control. Only then should improvement activities be initiated to reduce variation and/or change the mean of a controlled parameter.
 It’s good practice, where it makes sense, to have workers post their control charts where they are visible to the workers and to managers. Remember, managers are workers and are also responsible for processes. Sometimes managers should have control charts for their processes and these should be visible to others except where the charts involve private data relating to people. Having control charts visible to all reinforces the intent to manage on the basis of data rather than someone’s guesses or intuition.
Financial and productivity related data should be available to all as is necessary for evaluating process improvements. Providing such data also helps build and maintain trust in management. Workers are trusted with trade secrets that are far more valuable than typical financial data. Denying them access to financial information prevents them from accurately calculating the cost savings from their process improvement actions and tends to build distrust of management.
A quick search of the web shows that there are numerous vendors offering software packages to assist with generating the subject charts and diagrams. I think it’s a better learning experience to have workers learn how to generate the products by hand before having access to software. The software isn’t really necessary and not having used the commercial products I can’t attest to their utility or cost effectiveness. Therefore I recommend students learn without the help of commercial software and then try a commercial product and determine for themselves if it is a good investment. It may be that such products save time and result in fewer errors so that they pay for themselves over time. I would caution the student that if the software automates most of the data collection and processing to observe carefully to learn whether using such automated tools reduces the ownership workers have in the control of their processes. If they feel the software is being imposed on them and their processes by management it may demotivate them. Of course a wise approach is to let the workers decide if such tools are helpful and cost effective.
After workers are trained, empowered and monitored properly they should take responsibility for fixing special cause variation without involving managers. Knowledge workers can also take responsibility for improving their processes, i.e. reducing common cause variation, without having to get permission from or involving managers. This frees managers from many of the daily crises that take time away from maintaining and improving their own processes. Workers controlling their processes effectively are the basis for the claim in the introduction to this course that if a manager practices the methods taught here there are fewer crises requiring management attention and therefore more time to work on important long term problems.
Learning to Think Statistically
Many books on leadership advise their readers to trust their intuition in making decisions. I wholeheartedly agree with this advice. Being effective often requires making decisions with limited data. In my experience decisions based on available data plus intuition are correct most of the time and the benefits gained from timely decisions outweigh the costs of the few times mistakes are made. I believe that the quality of decisions based on intuition can be improved by learning to think statistically. Thinking statistically means using available data, your experience and your intuition to make judgments based on probability and statistics in situations where statistics apply.
One objective of learning to think statistically is to no longer spend any time explaining obvious common cause variation or asking others to explain common cause variation. Such mistakes are common in analyzing and discussing financial data and productivity data. I have had to sit through or read through countless examples of someone explaining why this months’ expenses for something are up by x% or this months’ sales missed the forecast by y% when the common cause variation in the parameters under discussion was greater than x or y%. It should be obvious to the student at this point that such discussions are a complete waste of time and frustrating to those who have learned to think statistically. Explanations are only called for if a parameter exceeds an agreed upon control limit. Feeing one from such time wasters makes time available for process improvement, growing the organization, working with customers and other effective work.
Weekly or monthly reports are a typical place where seemingly learned discussions of common cause variation are popular. That is another reason why I never liked weekly reports. If you are required to write such reports make sure you are not wasting both your time and your supervisors’ time by discussing common cause variation unless it is in the context of a process improvement action.
Learning to think statistically takes practice. Try to recognize common and special cause variation even when you don’t have a control chart available. Often your experience and intuition are sufficient. This is a useful skill in daily life but should never be a substitute for managing work processes on the basis of data. A good way to practice is by reading or listening to news reports. Think about reported incidents and assess whether you think they are due to special or common cause. An example is a report that some people are concerned because they believe there is a high incidence of “x” in their community. The “x” might be cancer, crime or some similar undesirable event. The fact that the community is concerned is newsworthy, whether or not the concern is justified depends on whether the high incidence of “x” is special or common cause variation. Typically insufficient data is reported to enable an accurate decision. In such cases make an educated guess for the practice.
Try assigning probabilities to events and assigning relative importance to reported events based on your knowledge of the statistics related to the event. An understanding of the statistics of normal distributions applied to limited data given in news reports is often sufficient to make a determination of common or special cause variation with good probability of being correct. You soon find that the newsworthiness of an event often is not proportional to the relative importance of the event compared to other similar events. That is ok for the news media; their first priority is to interest their audience. It’s usually up to the audience to put events into proper context and statistical thinking is essential to achieving a good understanding of news events.
As you learn to think statistically you begin to look at work data more carefully. You do not jump to conclusions without collecting and examining data to determine whether something is common or special cause. You stop wasting time looking for explanations of common cause variation and hopefully go to work improving the processes under your control. You take appropriate actions and stop taking inappropriate actions in the presence of variation.
Appropriate actions to take for processes (the system) that exhibit variation are summarized in the chart shown in figure 19.


Figure 19 Appropriate actions in response to variation.
Brian Joiner, cited above, also has a great summary of “Consequences of Inappropriate Management Actions (i.e. violations of the rules summarized in figure 19):
        Wasted time and energy
        More variation in the system
        Loss of productivity
        Loss of confidence in the manager
        Problems continue”
As shown in figure 19 the system should not be adjusted in the presence of common cause variation. This is called tampering by W. Edwards Deming and just makes the variation worse. If special cause variation is present then you must “Look for the Difference”, i.e. look for the reason that the variation in question is not within the control limits. There is usually some anomaly that accounts for the special cause variation and this anomaly must be corrected so that out of control limits variation doesn’t continue. It is possible that the system has changed and therefore needs adjustment as indicated in column two. However, do not adjust the system if it has not changed as that would be an inappropriate action. The best training example of the results of inappropriate actions is W. Edwards Deming’s famous funnel experiment. If the student has access to the Deming video tapes I strongly recommend watching the tape on the funnel experiment. If that tape isn’t available an excellent alternative is available thanks to Dr. Yonatan Reshef, of the School of Business at University of Alberta. It’s discussed in the first exercise for this lecture.
After you have learned statistical methods, learned to think statistically, trained your workers and empowered them your organization will take fewer inappropriate actions and more appropriate actions and the organization’s effectiveness will increase.

Exercise 1

The Funnel Experiment

Go to the web site http://www.business.ualberta.ca/yreshef/orga432/funnel.html and study the funnel experiment. Dr. Reshef provides the rules and has a demonstration that you can download and work through yourself. Please take the time to work through the exercise. It is important to engrain in your mind the principles associated with inappropriate actions. If you have difficulties getting clear results from Dr Reshef’s demonstration you can see the results of a computer simulation of the funnel experiment at http://www.spcforexcel.com/ezine/july2006/july_2006.htm#article4 Click on funnel experiment in the contents list on this web page.
The objective of the exercise is to learn the difference between tampering (some call it tinkering) and true process improvement. All workers that you plan to empower to control their own processes should work through the funnel experiment as part of their training.
After studying the funnel experiment listen carefully to politicians in the news. As they recommend actions consider whether the recommended actions are tampering or sound process improvements. As you become more expert at statistical thinking you will notice that many politicians recommend actions that sound good to their constituents; often independent of whether the recommended actions are appropriate for the variation that precipitated their recommendation. Also, listen to other managers and your superiors as they suggest responses to problems. Try to assess if their suggested responses are sound process improvements or a form of tampering. These exercises help engrain the teachings of the funnel experiment in your mind.

Exercise 2

The Red Bead Experiment

Another of Deming’s famous experiments is the red bead experiment. You can learn about the red bead experiment at http://www.redbead.com/docs/expressindia19111998.html by reading the article by Manjari Raman. This article provides a clear definition of the experiment and a concise summary of the teachings of the red bead experiment. There is additional useful information at www.redbead.com but I strongly recommend that you buy Dr. Deming’s video for your organization. It is available at http://www.trainingabc.com/xcart/product.php?productid=16249&cat=254&page=1.
Observing the red bead experiment carefully or participating in the experiment is a powerful learning experience. Watching the behavior of participants is an amazing demonstration of the human nature that we encounter every day in our work. Workers try to do the impossible when bosses demand it even though the workers know that they cannot succeed. And we have all seen bosses who demand the impossible from workers in a system that is incapable of enabling the workers to achieve what they have been asked to do. Some trainers recommend that managers and their workers jointly do the red bead experiment and discuss it together as a step on the way to changing the behavior in their organization. I think that it is sufficient to watch the experiment but I think it is very important for the student to watch it, not just read about it. After viewing and perhaps discussing the red bead experiment with others, the student is likely to be less enthusiastic about arbitrary goals and management exhortations or slogans. Also it’s likely that the student will develop a more favorable assessment of the willingness of most workers to attempt to do whatever management requests. These likely changes help make the student a more effective manager.
If you find that the pace of blog posts isn’t compatible with the pace you  would like to maintain in studying this material you can buy the book “The Manager’s Guide for Effective Leadership” in hard copy or for Kindle at:
or hard copy or for nook at:
or hard copy or E-book at:


Tuesday, May 28, 2013

26 Introduction to Variation

W. Edwards Deming, the famous quality improvement guru, claimed that the two most important things for managers to understand are:
1.     Variation and how to deal with it
2.     The forces that motivate and demotivate people
The subjects of the first 21 lectures, motivating, staffing and communicating, address the forces that motivate and demotivate people, i.e. the Theory Z portion of effective leadership. Forces mean the collection of perceptions, understandings and misunderstandings that influence the attitude and behavior of people. Lectures 23 – 25 introduced management of processes, part of the control function of managers, and treated the stand alone topics of managing risk and theory of constraints. Now we turn to variation and how to deal with it, the central theme of process improvement and process control. Managing in the presence of variation is also part of the control function of managers.
W. Edwards Deming claimed that the inability to interpret and use the information in variation is the main problem for managers and leaders. (See the book Out of the Crisis by W. Edwards Deming) When there is a problem with any work process the manager and the employees both must understand when the manager must act and when employees must act. It is through an understanding of variation and the measurement of variation that they understand when and who should take action and, just as importantly, when not to take action. Thus variation is involved in both improving poor processes and maintaining good processes.
Variation is just the reality that actual values of parameters, physical or financial, have some statistical spread rather than being exactly what we expect, specify or desire. For example, we may have a budget for supplies of $1000 per month. When we look at spending for each month it is typically close to but not exactly $1000. Over time the spending might look like that shown in figure 15.


Figure 15. An example of variation from planned budget by actual spending.
For our purposes the definition of variation is deviation from planned, expected or predicted values of any parameter. The parameter might be financial, as in the example shown in figure 15, it might be in units of production per day or minutes per service, or it might be a physical parameter, such as the dimension of a machined part. Thus variation occurs in all the work processes of any kind of organization. Therefore, as Deming implied, the effective leader must understand the information in variation and how to properly manage in the presence of variation.
Let’s start by returning to the work process illustrated in figure 12, the SIPOC diagram.  Where might we expect to see variation in a work process? The answer is everywhere. Deviations from ideal inputs are variation. Deviations from ideal outputs are variation. Deviations from expectations in use are variation. Variation in use can be due to either hidden variation in outputs or unexpected variation in the use environment or the use process.
Let’s define an effective process from a customer’s point of view. It is a process that produces outputs that meet or exceed the customer’s expectations for quality and cost. Customers can be internal or external to the enterprise or the organization that owns the process. Customers have stated and unstated expectations. Specifications, requirements, standards, and contract items are examples of customer’s stated expectations. Customer’s unstated expectations are typically suitability for all conditions of use and affordability. Therefore, for the purposes of process improvement discussions, we can say that an organization’s effectiveness is determined by the effectiveness of its processes in satisfying its customer’s expectations. (In general the effective organization must satisfy all its stake holders’ expectations, including managers, workers, owners and the community as well as the customers.)

Variation Drives Process Effectiveness

We can see the effects of variation by examining an ideal business process (figure 12, an ideal process is repeated in the top half of figure 16) and a typical process as shown in the bottom half of figure 16.


Figure 16. Comparison of a typical process to an ideal business process.

An ideal process converts all of the supplier’s inputs to outputs that satisfy the customer’s expectations. A typical process includes inspection steps to ensure that a defective input is not sent to the process or a defective output is not sent to the customer. The customer also adds an inspection step because of receiving defective outputs in the past. If outputs fail any of these inspections the failed item is scrap or must be reworked. It’s easy to see that the typical process is more expensive, and therefore less effective, than an ideal process because inspections cost money and scrap or rework cost money. In a typical chain of processes costs of failing inspection increases as the work progresses along the chain because more rework is required if an inspection is failed at processes near the end of the chain. Thus often the largest cost to the organization is warranty costs from customer returns. That is the reason for the inspection of the outputs before they are sent to the customers. The reason these inspection steps are added is the presence of variation. If there was no variation in the inputs or the outputs then there would be no need for inspection to find those items whose variation from ideal is larger than acceptable.
Notice that even the ideal process has inputs and outputs that exhibit variation but for the ideal process this variation is within acceptable limits most of the time. We need to define what we mean by “most of the time”. If there is variation then sooner or later a product will fail to meet customer expectations if there is no inspection. (Actually it will happen even with inspection since no inspection is perfect, i.e. inspection is a process that also has variation.) If the variation is small enough so that only rarely is there a customer return and the cost of correcting this return plus the cost of the disgruntled customer is less than the cost of including inspection then it makes business sense to not have inspection.
Now I hope the student is thinking that to make a valid decision to not include inspection takes data to establish that the variation is sufficiently low. The astute student is also thinking that collecting such data costs money also, perhaps as much as the inspection. This is an example of what is meant by a manager needing to know how to manage in the presence of variation. Next we examine how a manager can achieve such understanding and make good decisions in the presence of variation.

Variation is a Statistical Phenomenon

To understand managing in the presence of variation we must answer the questions how can the manager decide:
·       when to take action,
·       what action to take and
·       who should take the action?
Managing correctly in the presence of variation requires the use of methods based on statistics since variation is a statistical phenomenon. The statistics needed for 85% or so of a manager’s work is relatively simple and easily learned. The effective leader and all workers must understand and use these simple methods. However, there are situations that require more elaborate statistics. Every organization should have access to at least one person well versed in statistical methods so that managers and process improvement teams have a resource to check their work and assist on complex problems. This statistical expert can be a consultant or a worker that is well trained in statistics.
Here we are going to briefly look at some of the most important simple methods. As an example, figure 17 illustrates the daily averages of phone expenses for an organization plotted for each month of a year.


Figure 17 A graph of an organization’s daily phone expenses averaged for each month of a year.
Should the manger take action in response to the March expenses? The June expenses? If action is necessary in response to the March expenses, whose action is it? The manager’s? The workers? If the manager is expected to discuss unusual expenses in a weekly or monthly report what should the manager say about the March and June expenses?
Control charts are a visual method of answering the questions posed about the phone bills. A control chart for the phone expenses data from figure 17 is shown in figure 18. You can learn how to generate control charts later. For now I only partially describe how to interpret the data in a control chart.


Figure 18 A control chart for the example phone expense data.
The line with diamond markers is the same data shown in figure 17. The line with the square markers results from averaging the data over a whole year. The line with the triangle markers shows the range of variation of daily expenses for a given month. The two lines labeled Upper CL and Lower CL are upper and lower control limits, which are statistically determined from the data set. For the purposes of this introduction it isn’t necessary to know how to calculate the control limits. The control chart tells us that, with the exception of the March data point, the phone expenses are stable, that is they exhibit variation about a stable sample average, which is not steadily increasing or decreasing. A stable process is predictable, e.g. frequency of errors, efficiency, process capability and process cost are predictable. Deliberate changes to a stable process can be evaluated.  Note that some process improvement literature refers to a stable process as being “in control”.
Variation exhibiting a stable statistical distribution is due to the summation of many small factors and is called common cause variation. Changes to a stable process, i.e. one with common cause variation is typically the manager’s responsibility but can be the responsibility of trained and empowered workers. Knowledge workers should be responsible for common cause variation because they are usually more expert with respect to their processes than their managers. However, as is described in the next lecture, even knowledge workers should not be empowered to control their processes before they have been trained in statistical methods because mistakes can make processes worse.
Only the data point for one month, March, falls above or below the two control limit lines. Variation that is outside the stable statistical distribution, i.e. above the upper control limit or below the lower control limit, is special cause variation.  The point for March falls below the lower control limit. This means that the March data is special cause variation. Special cause variation is the workers responsibility; they typically know more about possible causes than the manager because they are closer to the process. But the workers need training in problem solving to fix special cause variation and they need to be empowered to make fixes to their processes.
The workers should review the data for March and examine the phone system to see if they can determine the reason the daily averages were so low. For example, the phones may have been out of order for a week, which would have lowered the daily expenses but require no action other than getting the system operating again. Properly trained and motivated workers can handle special cause problems, usually without any management involvement.
A stable process is a good candidate for process improvement. The goal of process improvement for a stable process is to reduce the variation and/or change the mean. Process improvement should not be attempted on a process that is unstable until the process is brought to a stable condition because changes in data taken on an unstable process cannot be uniquely attributed to the action of the process improvement. The special cause variation that makes the process unstable must be removed before beginning process improvement.
Note that the control chart also provides the manager information useful in considering process improvement. In the example shown in figure 18 the yearly average phone expenses are about $21 per day. A manager can evaluate the cost benefit of making a change to the phone service based on this data since it is stable over a year. If the manager can make a change without investment that promises a 10% reduction in phone expenses the manager can see that data will have to be monitored for about four to six months to determine if the mean daily expenses do indeed drop from $21 to $19 because the normal range of variation in monthly averages is larger than the expected change. However, if the change really works as promised then in about four to six months the monthly averages should begin to vary about a new long term average and the control chart will show this change.

Exercise

1.     Go to “Control Charts” in Wikipedia (http://en.wikipedia.org/wiki/Control_) and read the article. This material expands upon the introduction given in this lecture.
2.    Go to http://www.goalqpc.com/shop_products.cfm and buy yourself a copy of Memory Jogger II. This handy book teaches everything you need to know about problem identification and problem analysis. It is small enough to carry in your pocket and it is your guide to the details of process improvement. If you prefer a spiral bound version it is available from Amazon.com (Michael Brassard, and Diane Ritter, The Memory Jogger II: A Pocket Guide of Tools for Continuous Improvement and Effective Planning) There is also a Six Sigma Memory Jogger available.
The Memory Jogger book recommended here is so widely used and so effective for the practical user that there is no point in repeating the material in this course. The student is expected to study the Memory Jogger and put the techniques into practice. This means that the student and all the people reporting to the student are to have the Memory Jogger book , or an equivalent, be trained in the techniques summarized in the book and put these techniques into practice. This is essential if an effective organization is expected. The exception is if your organization is following the Six Sigma approach where only selected people are highly trained.
If you prefer not having to learn statistical techniques yourself you can attend training if your budget and schedule permits. One example workshop in statistical process control is offered by the American Supplier Institute. See: http://www.amsup.com/spc/1.htm. This workshop focuses on manufacturing but the techniques work for any type of organization. A web search reveals many other training organization offering similar programs. I have found it more cost effective when training all workers to bring the trainer to the organization rather than sending workers to outside training.

If you find that the pace of blog posts isn’t compatible with the pace you  would like to maintain in studying this material you can buy the book “The Manager’s Guide for Effective Leadership” in hard copy or for Kindle at:
or hard copy or for nook at:
or hard copy or E-book at:


Wednesday, May 22, 2013

25 Overview of Theory of Constraints

The theory of constraints involves techniques for improving processes that have to be learned independently of the material we address in subsequent lectures. This theory should be applied to business processes before beginning the process improvement methods that are discussed in the following lectures. If the student understands the theory of constraints and if this theory is being applied to the business processes the student is concerned with then this lecture can be skipped. If not, this overview introduces the theory and gives the student some feeling for the necessity for learning and using this theory.
Theory of constraints deals with aspects of control often neglected or wrongly presented in standard texts. I suspect the likely reason is that theory of constraints as applied to business organizations was made popular outside of business schools by a physicist, Eliyahu M. Goldratt. Theory of constraints is described by Goldratt via his books The Goal, The Race, Critical Chain & other process oriented management books. These books are “business novels” and enjoyable reads as well as being excellent self-training books. Theory of constraints is appropriate to processes associated with manufacturing operations, back and front office service operations and projects. I distinguish between back and front office service operations because although theory of constraints applies to front office service operations it shouldn’t be the main focus when dealing directly with customers. This is because it is better to be effective with customers than to be highly efficient at the expense of some effectiveness.
Theory of constraints is based on the fact that the throughput of a process can be no greater than the throughput of the slowest step in the process, i.e. the constraint. It is a simple and seemingly obvious concept but having seen many offices with desk after desk stacked with paper work waiting to be processed and many factories with work in process stacked around machine after machine I can tell you that it isn’t obvious to many managers in spite of the fact that violating this theory leads to inefficient operations and excessive costs.
A basic work process, applicable to any organization, is shown in figure 12.


Figure 12 A basic work process has suppliers, inputs, outputs and customers.
This chain is often called SIPOC after the initials of each element in the chain. Manufacturing, project and back office service processes are typically many step processes, each with suppliers, inputs, outputs, & customers. A simple example with ten steps is shown figure 13. Each circle with an S is a SIPOC chain in which the preceding S is the supplier of inputs to the S and the following S is the customer for its outputs. Note that a process can have more than one supplier, as S4 is supplied by S3 and S8 in this figure. Similarly a process can have more than one customer. A more complex, but typical process might have loop backs where material or paperwork not meeting standards is sent back to an earlier process for rework.


Figure 13 Typical business processes integrate many individual SIPOC processes.
If we assume that each of the steps shown in figure 13 has a different through put then the theory of constraints states that the through put of the overall process cannot be any larger than the through put of the slowest step. If the manager in charge of an overall process like that illustrated in figure 13, with each step having a different through put, expects the workers to stay busy you can imagine what results. Work in process (WIP) builds up in from of all steps that are slower than the previous step. This excess WIP can lead to several problems, including:
·       In manufacturing operations and in some project operations the WIP leads to excess inventory costs.
·       Associated with excess WIP is excess cycle time, i.e. the time from the first step to the final step in the overall process.
·       If a worker at one of the non-constraining step begins to make errors in paperwork or if a machine at a non-constraining step begins to produce defective parts then excess costs result from the extra rework required on all the defective material produced before the problem is detected at some subsequent step
·       Eventually expediters and/or overtime are added to ensure that time critical work is located and processed at the expense of other less critical work, leading to excess labor costs.
A second, and again often overlooked, result of the theory of constraints is that there are no additional costs incurred if workers at non-constraining steps are idle as long as there is material available for the worker or machine at the next step. This means that if such workers are cross trained then they can do other productive work when there is a buffer of output work after their step. The value of workers doing other work justifies paying premium wages to workers that are cross trained and the cost of cross training.
Most important is that workers at non-constraining processes have time to spend on process improvement and, since total productivity is not reduced, there is no additional cost for the process improvement labor. This is one reason theory of constraints should be applied to work processes before initiating other process improvement activities.
Figure 14 illustrates how to control processes with a constraining step.


Figure 14 Adding buffer inventories and controlling work material release controls work in process for processes with constraining steps.
In the example shown in figure 14 step 3 is assumed to be the constraining step. Buffer inventory is maintained in front of step 3, indicated by the small rectangle, so that it can never be idle due to lack of input. The size of the buffer in front of step 3 is controlled by the rate of work material released to the input of step 1, indicated by the dotted line from the input of step 1 to the buffer inventory at the input to step 3. It is also correct practice to add a buffer in front of step 4 and regulate the input to step 5 to control the size of this second buffer. The reason for the second buffer is to ensure that step 4 does not become the constraining step due to material not being available from step 8. Note that this process control approach applies to any type of business that involves material, i.e. paper, electronic media or parts, moving from step to step to accomplish an overall work objective.
A personal experience is a good illustration of the problems caused by not applying the theory of constraints. I was asked to consult for a factory that was in danger of being shut down and the work moved out of the country because the corporate office was not satisfied with the factory’s performance. A quick tour showed that there was excess WIP nearly everywhere. In fact a special material handling system had been installed just to deal with the partially finished goods throughout the factory. A few questions revealed that the constraining process was the final process before the products were boxed and shipped.
I held a Saturday training system for the managers. I asked them what the cycle time was for their products. They answered that it was about 35 days from first material release to shipping products made with that material. I then asked what the cycle time would be if material moved from process to process with no waiting time in front of each process. They thought awhile and answered that it would be 7 days. A few more leading questions and I could see light bulbs coming on in a few minds and excited expressions on faces. Incidentally, the first person that comprehended what they had been doing wrong was a woman doing administrative work in the front office. By Monday they had plans worked out to change their methods and were starting to implement the plans.
I called the general manager a couple of months later and asked if the cycle time had changed. They had two products going through the same production line. He said the cycle time for one product had been reduced to the ideal 7 days by applying theory of constraints. They began releasing material into the line at the rate of the final constraining process and maintained buffer work in process only in front of the constraining process. Unfortunately, he was not allowed to control the release of material for the second product and its cycle time was still about 35 days. Corporate marketing people controlled the release of material for the second product and they released it according to their sales instead of the factory capabilities. I never learned if the general manager was able to convince corporate management that marketing’s control of material release for the second product was the cause of the factory’s excess cycle time, excess WIP and associated excess costs.
This short introduction to the Theory of Constraints illustrates the principle. Managers of manufacturing or back office service operations should study Theory of Constraints, just in time (JIT) inventory control and Lean techniques and understand the value of small lot size in controlling the cost of poor quality. Project managers should study critical path scheduling as well as the theory of constraints. I recommend project managers read Goldratt’s book Critical Chain, which addresses scheduling for projects.

Exercise

Like lecture 23 this lecture is only an introduction and no exercises are required unless the student isn’t familiar with the theory of constraints and using it already. If the student isn’t knowledgeable in these techniques and isn’t already using them then additional self-study is necessary to learn how to put them into practice for real business processes, which tend to be more complex than the simple example used here to illustrate the principles involved. I recommend reading Goldratt’s books because they are fun reads as well as excellent for self-training.

If you find that the pace of blog posts isn’t compatible with the pace you  would like to maintain in studying this material you can buy the book “The Manager’s Guide for Effective Leadership” in hard copy or for Kindle at:
or hard copy or for nook at:
or hard copy or E-book at: